Langgan Saluran FX V.1.3.1
Kalkulator margin
Kira margin minimum yang diperlukan setiap lot

-
Sesi Dagangan (pemula)
-
Masa kejadian harga tinggi/rendah harian (pemula)
-
Rintangan dan sokongan carta (Pemula)
-
Laporan CFTC COT (pemula)
-
Pengesanan Gelombang Elliott (Pertengahan)
Sesi dagangan
Market Sessions
Kod program:
Pine Script
Pengenalan:
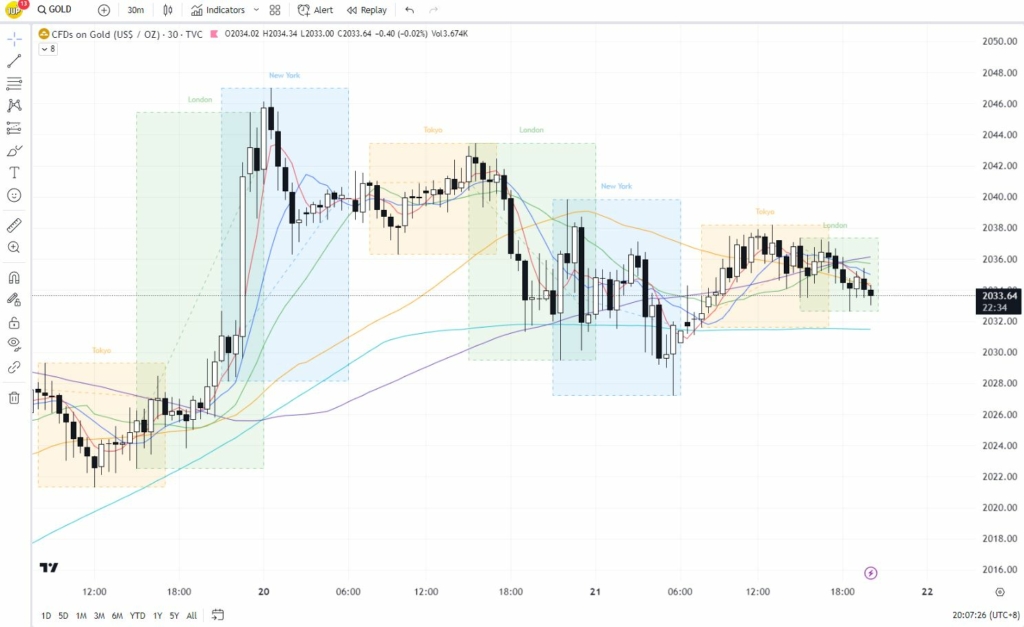
Penunjuk mudah yang membantu anda menjejaki 4 sesi dagangan pasaran (Tokyo, London, New York, Sydney secara lalai), dipersembahkan dalam 4 bentuk visual yang berbeza (kotak, garis masa, kawasan, batang lilin berwarna) dan menyediakan Banyak alat berguna lain. Penunjuk ini boleh membantu anda lebih memahami aktiviti dan pertindihan masa pelbagai sesi dagangan pasaran, membolehkan anda merancang dan melaksanakan strategi dagangan dengan lebih baik.
Fungsi:
Anda boleh menunjukkan/menyembunyikan semua sesi dagangan, menamakan semula, menukar warna dan menetapkan masa mula/tamat. Anda boleh menyesuaikan penampilan dan tetapan penunjuk untuk memenuhi keperluan dagangan dan keutamaan peribadi anda. Sesuaikan ia dengan keperluan dan rangka masa anda untuk menjejak dan menganalisis aktiviti pasaran dengan lebih baik.
Ciri tambahan:
- "Tukar (Pips)" - akan menambah perbezaan pip antara tinggi dan rendah sesi dagangan, atau harga buka dan tutup sesi dagangan, pada label sesi dagangan.
- "Tukar (%)" - akan menambah perbezaan peratusan antara tinggi dan rendah sesi dagangan, atau perbezaan peratusan antara harga pembukaan dan penutupan sesi dagangan, pada label sesi dagangan.
- "Gabung Bertindih" - Ini akan menggabungkan sesi dagangan bertindih, menunjukkan hanya satu sesi pada satu masa (masa tamat Tokyo berpindah ke masa mula London, masa tamat London berpindah ke masa mula New York, masa tamat New York berpindah ke masa mula Sydney, Sydney masa tamat berpindah ke masa mula Tokyo).
- "Sembunyikan Hujung Minggu" - Ini akan menghalang skrip daripada melukis sesi dagangan pada hujung minggu (apabila pasaran ditutup).
- "Barisan Buka/Tutup" - Ini menarik garisan daripada harga pembukaan sesi dagangan kepada harga penutup (atau harga semasa jika sesi dagangan sedang berjalan).
- "Tempoh 0.5 Tahap" - Ini akan menarik garis mendatar antara sesi dagangan tinggi dan rendah, separuh ke bawah.
- "Lilin Berwarna" - Ini akan mewarnakan lilin menggunakan warna sesi dagangan untuk menunjukkan sesi dagangan yang dimilikinya.
- "Jenis Paparan" - Pilih antara tiga cara berbeza untuk menggambarkan sesi dagangan (Kotak, Kawasan dan Batang Lilin).
- "Hari Imbas Kembali" - Input ini memberitahu skrip untuk hanya merancang sesi dagangan untuk X hari lalu (1 = 1 hari).
- "Tukar (% / Mata)" - Pilih tab "Tukar (Mata)" dan "Tukar (%)" di sini. Memilih "Sesi Dagangan Tinggi/Rendah" akan menunjukkan jumlah perubahan antara sesi dagangan tinggi dan rendah, dan memilih "Sesi Dagangan Buka/Tutup" akan menunjukkan jumlah perubahan antara sesi dagangan dibuka dan ditutup.
- "Zon Masa Input" - Ini mentakrifkan zon waktu untuk input masa mula/akhir sesi dagangan (anda tidak perlu menukar ini melainkan anda tahu apa yang anda lakukan).
// This source code is subject to the terms of the Mozilla Public License 2.0 at https://mozilla.org/MPL/2.0/
// © 1uptick

//@version=5
indicator("Market Sessions", overlay = true, max_boxes_count = 500, max_labels_count = 500, max_lines_count = 500)

// Box generation code inspired by Jos(TradingCode), session box visuals inspired by @boitoki

// Session 1 - user inputs
showTokyo      = input.bool(true, '', inline='Tokyo', group='Sessions')
stringTokyo    = input.string('Tokyo', '', inline='Tokyo', group='Sessions')
TokyoTimeX     = input.session(defval="0000-0900", title='     ', inline='Tokyo2', group='Sessions', tooltip = 'If you want to change the start/end time of the session, just make sure they are in UTC. There is no need to change the timezone of your Tradingview chart or to change the Timezone input below, because the sessions will be plotted correctly as long as the start/end time is set in UTC.')
TokyoCol       = input.color(color.rgb(255, 153, 0, 90), '' , inline='Tokyo', group='Sessions')
// Session 2 - user inputs
showLondon     = input.bool(true, '', inline='London', group='Sessions')
stringLondon   = input.string('London', '', inline='London', group='Sessions')
LondonTimeX    = input.session(defval="0700-1600", title='     ', inline='London2', group='Sessions', tooltip = 'If you want to change the start/end time of the session, just make sure they are in UTC. There is no need to change the timezone of your Tradingview chart or to change the Timezone input below, because the sessions will be plotted correctly as long as the start/end time is set in UTC.')
LondonCol      = input.color(color.rgb(76, 175, 79, 90), '' , inline='London', group='Sessions')
// Session 3 - user inputs
showNewYork    = input.bool(true, title='', inline='New York', group='Sessions')
stringNewYork  = input.string('New York', '', inline='New York', group='Sessions')
NewYorkTimeX   = input.session(defval="1300-2200", title='     ', inline='New York2', group='Sessions', tooltip = 'If you want to change the start/end time of the session, just make sure they are in UTC. There is no need to change the timezone of your Tradingview chart or to change the Timezone input below, because the sessions will be plotted correctly as long as the start/end time is set in UTC.')
NewYorkCol     = input.color(color.rgb(33, 149, 243, 90), '', inline='New York', group='Sessions')
// Session 4 - user inputs
showSydney     = input.bool(false, title='', inline='Sydney', group='Sessions')
stringSydney   = input.string('Sydney', '', inline='Sydney', group='Sessions')
SydneyTimeX    = input.session(defval="2100-0600", title='     ', inline='Sydney2', group='Sessions', tooltip = 'If you want to change the start/end time of the session, just make sure they are in UTC. There is no need to change the timezone of your Tradingview chart or to change the Timezone input below, because the sessions will be plotted correctly as long as the start/end time is set in UTC.')
SydneyCol      = input.color(color.rgb(164, 97, 187, 90), '', inline='Sydney', group='Sessions')
// Additional tools and settings - user inputs
pipChange      = input.bool(false, 'Change (Pips) ', inline='0', group = 'Additional Tools and Settings')
percentChange  = input.bool(false, 'Change (%)', inline='0', group = 'Additional Tools and Settings')
merge          = input.bool(false, 'Merge Overlaps', inline='2', group = 'Additional Tools and Settings')
hideWeekends   = input.bool(true, 'Hide Weekends', inline='2', group = 'Additional Tools and Settings')
sessionOC      = input.bool(true, 'Open/Close Line', inline='3', group = 'Additional Tools and Settings')
halfline       = input.bool(false, 'Session 0.5 Level', inline='3', group = 'Additional Tools and Settings')
colorcandles   = input.bool(false, 'Color Candles  ', inline='4', group = 'Additional Tools and Settings')
showScreener   = input.bool(false, 'Screener (Soon)', inline='4', group = 'Additional Tools and Settings')
displayType    = input.string('Boxes', 'Display Type', options = ['Boxes', 'Zones','Timeline', 'Candles'], group='Additional Tools and Settings', tooltip='Choose whether the scripts should plot session in the for of boxes or colored background zones.')
daysBack       = input.float(150, 'Lookback (Days)', group='Additional Tools and Settings', tooltip= 'This inputs defines the lookback period for plotting sessions. Eg. If it is set to 1, only the sessions of the past day will appear')
changeType     = input.string('Session High/Low','Change (%/Pips) Source', options = ['Session High/Low', 'Session Open/Close'], group='Additional Tools and Settings', tooltip='Choose whether the Change (%) and Change (Pips) should measure the distance between Session High and Session Low or the distance between Session Open and Session Close.')
SessionZone    = input.string("UTC", title="Input Timezone", group='Additional Tools and Settings', tooltip = 'This input is defining the timezone for the session times selected above. It has nothing to do with the timezone of your chart, because the sessions will be plotted correctly even if your chart is not set to UTC.')
// Appearance - user inputs
borderWidth    = input.int(1, 'Box Border', inline='border', group='Appearance')
borderStyle    = input.string('Dashed', '', ['Solid', 'Dashed', 'Dotted']  , inline='border', group='Appearance', tooltip='Select the width and style of session box borders')
levelsStyle    = input.string('Dashed', 'Line Style', ['Solid', 'Dashed', 'Dotted'], group='Appearance', tooltip='Select the style of 0.5 and Open/Close lines.')
labelSize      = input.string('Normal', 'Label Size', options = ['Auto', 'Tiny', 'Small', 'Normal'], group='Appearance', tooltip='Select the size of text labels.')
showLabels     = input.bool(true, 'Session Labels ', inline='00', group = 'Appearance')
colorBoxes     = input.bool(true, 'Box Background', inline='00', group = 'Appearance')

// Excluding or Including Weekends
var TokyoTime   = hideWeekends ? TokyoTimeX+":123456" : TokyoTimeX+":1234567"
var LondonTime  = hideWeekends ? LondonTimeX+":123456" : LondonTimeX+":1234567"
var NewYorkTime = hideWeekends ? NewYorkTimeX+":123456" : NewYorkTimeX+":1234567"
var SydneyTime  = hideWeekends ? SydneyTimeX+":123456" : SydneyTimeX+":1234567"

// Defining Line Style and Label Size Variables
lineStyle(x) =>
    switch x
        'Solid'  => line.style_solid
        'Dashed' => line.style_dashed
        'Dotted' => line.style_dotted
labelStyle(x) =>
    switch x
        'Auto'   => size.auto
        'Tiny'   => size.tiny
        'Small'  => size.small
        'Normal' => size.normal

// Calculating inRange, used for lookback
MSPD        = 24 * 60 * 60 * 1000
lastBarDate = timestamp(year(timenow), month(timenow), dayofmonth(timenow), hour(timenow), minute(timenow), second(timenow))
thisBarDate = timestamp(year, month, dayofmonth, hour, minute, second)
daysLeft    = math.abs(math.floor((lastBarDate - thisBarDate) / MSPD))
inRange     = daysLeft < daysBack

// Session Time
InTokyo(TokyoTime, TokyoTimeZone=syminfo.timezone)       =>
    not na(time(timeframe.period, TokyoTime, SessionZone))
InLondon(LondonTime, LondonTimeZone=syminfo.timezone)    =>
    not na(time(timeframe.period, LondonTime, SessionZone))
InNewYork(NewYorkTime, NewYorkTimeZone=syminfo.timezone) =>
    not na(time(timeframe.period, NewYorkTime, SessionZone))
InSydney(SydneyTime, SydneyTimeZone=syminfo.timezone)    =>
    not na(time(timeframe.period, SydneyTime, SessionZone))

// Creating variables Session High, Low, Open and Session Boxes, Lines and Texts
var TokyoHighPrice     = 0.0, var TokyoLowPrice      = 0.0, var TokyoOpenPrice     = 0.0, var box TokyoBox       = na, var line TokyoLine     = na, var label TokyoLabel   = na, var line TokyoOC       = na, var string TokyoText   = str.tostring(stringTokyo)
var LondonHighPrice    = 0.0, var LondonLowPrice     = 0.0, var LondonOpenPrice    = 0.0, var box LondonBox      = na, var line LondonLine    = na, var label LondonLabel  = na, var line LondonOC      = na, var string LondonText  = str.tostring(stringLondon)
var NewYorkHighPrice   = 0.0, var NewYorkLowPrice    = 0.0, var NewYorkOpenPrice   = 0.0, var box NewYorkBox     = na, var line NewYorkLine   = na, var label NewYorkLabel = na, var line NewYorkOC     = na, var string NewYorkText = str.tostring(stringNewYork)
var SydneyHighPrice    = 0.0, var SydneyLowPrice     = 0.0, var SydneyOpenPrice    = 0.0, var box SydneyBox      = na, var line SydneyLine    = na, var label SydneyLabel  = na, var line SydneyOC      = na, var string SydneyText  = str.tostring(stringSydney)

// Checking if session is active/has started
inTokyo        = InTokyo(TokyoTime, SessionZone)     and timeframe.isintraday
TokyoStart     = inTokyo   and not inTokyo[1]
inLondon       = InLondon(LondonTime, SessionZone)   and timeframe.isintraday
LondonStart    = inLondon  and not inLondon[1]
inNewYork      = InNewYork(NewYorkTime, SessionZone) and timeframe.isintraday
NewYorkStart   = inNewYork and not inNewYork[1]
inSydney       = InSydney(SydneyTime, SessionZone)   and timeframe.isintraday
SydneyStart    = inSydney  and not inSydney[1]

// Settings high, low, open at the beggining of the session
if TokyoStart
    TokyoHighPrice   := high
    TokyoLowPrice    := low
    TokyoOpenPrice   := open
if LondonStart
    LondonHighPrice  := high
    LondonLowPrice   := low
    LondonOpenPrice  := open
if NewYorkStart
    NewYorkHighPrice := high
    NewYorkLowPrice  := low
    NewYorkOpenPrice := open
if SydneyStart
    SydneyHighPrice  := high
    SydneyLowPrice   := low
    SydneyOpenPrice  := open

// Track session's max high and max low during the session
else if inTokyo
    TokyoHighPrice   := math.max(TokyoHighPrice, high)
    TokyoLowPrice    := math.min(TokyoLowPrice, low)
else if inLondon
    LondonHighPrice  := math.max(LondonHighPrice, high)
    LondonLowPrice   := math.min(LondonLowPrice, low)
else if inNewYork
    NewYorkHighPrice := math.max(NewYorkHighPrice, high)
    NewYorkLowPrice  := math.min(NewYorkLowPrice, low)
else if inSydney
    SydneyHighPrice  := math.max(SydneyHighPrice, high)
    SydneyLowPrice   := math.min(SydneyLowPrice, low)

// Plotting session boxes at the beginning of each session
if TokyoStart and showTokyo and inRange
    TokyoBox     := displayType=='Boxes' ? box.new(left=bar_index, top=na, right=na, bottom=na, border_width=borderWidth, bgcolor = colorBoxes ? TokyoCol : na, border_style = lineStyle(borderStyle), border_color=color.new(TokyoCol, 40)) : na
    TokyoLine    := halfline   ? line.new(x1=bar_index, y1=na, x2=na, y2=na, style=lineStyle(levelsStyle), color = color.new(TokyoCol, 40)) : na
    TokyoLabel   := showLabels ? label.new(x=na, y=na, text=TokyoText, textcolor=color.new(TokyoCol, 40), color=color.rgb(0,0,0,100), size=labelStyle(labelSize)) : na
    TokyoOC      := sessionOC  ? line.new(x1=bar_index, y1=TokyoOpenPrice, x2=na, y2=na, style=lineStyle(levelsStyle), color = color.new(TokyoCol, 40)) : na
if LondonStart and showLondon and inRange
    LondonBox    := displayType=='Boxes' ? box.new(left=bar_index, top=na, right=na, bottom=na, border_width=borderWidth, bgcolor = colorBoxes ? LondonCol : na, border_style = lineStyle(borderStyle), border_color=color.new(LondonCol, 40)) : na
    LondonLine   := halfline   ? line.new(x1=bar_index, y1=na, x2=na, y2=na, style=lineStyle(levelsStyle), color = color.new(LondonCol, 40)) : na
    LondonLabel  := showLabels ? label.new(x=na, y=na, text=LondonText, textcolor=color.new(LondonCol, 40), color=color.rgb(0,0,0,100), size=labelStyle(labelSize)) : na
    LondonOC     := sessionOC  ? line.new(x1=bar_index, y1=LondonOpenPrice, x2=na, y2=na, style=lineStyle(levelsStyle), color = color.new(LondonCol, 40)) : na
if NewYorkStart and showNewYork and inRange
    NewYorkBox   := displayType=='Boxes' ? box.new(left=bar_index, top=na, right=na, bottom=na, border_width=borderWidth, bgcolor = colorBoxes ? NewYorkCol : na, border_style = lineStyle(borderStyle), border_color=color.new(NewYorkCol, 40)) : na
    NewYorkLine  := halfline   ? line.new(x1=bar_index, y1=na, x2=na, y2=na, style=lineStyle(levelsStyle), color = color.new(NewYorkCol, 40)) : na
    NewYorkLabel := showLabels ? label.new(x=na, y=na, text=NewYorkText, textcolor=color.new(NewYorkCol, 40), color=color.rgb(0,0,0,100), size=labelStyle(labelSize)) : na
    NewYorkOC    := sessionOC  ? line.new(x1=bar_index, y1=NewYorkOpenPrice, x2=na, y2=na, style=lineStyle(levelsStyle), color = color.new(NewYorkCol, 40)) : na
if SydneyStart and showSydney and inRange
    SydneyBox    := displayType=='Boxes' ? box.new(left=bar_index, top=na, right=na, bottom=na, border_width=borderWidth, bgcolor = colorBoxes ? SydneyCol : na, border_style = lineStyle(borderStyle), border_color=color.new(SydneyCol, 40)) : na
    SydneyLine   := halfline   ? line.new(x1=bar_index, y1=na, x2=na, y2=na, style=lineStyle(levelsStyle), color = color.new(SydneyCol, 40)) : na
    SydneyLabel  := showLabels ? label.new(x=na, y=na, text=SydneyText, textcolor=color.new(SydneyCol, 40), color=color.rgb(0,0,0,100), size=labelStyle(labelSize)) : na
    SydneyOC     := sessionOC  ? line.new(x1=bar_index, y1=SydneyOpenPrice, x2=na, y2=na, style=lineStyle(levelsStyle), color = color.new(SydneyCol, 40)) : na

// Creating variables for alternative Sessions Box top and bottom (used for merging sessions)
var float TokyoHighM   = 0, var float TokyoLowM    = 0, var float LondonHighM  = 0, var float LondonLowM   = 0, var float NewYorkHighM = 0, var float NewYorkLowM  = 0, var float SydneyHighM  = 0, var float SydneyLowM   = 0

// Updating session boxes during sessions
if inTokyo and inRange
    TokyoHighPrice   := math.max(TokyoHighPrice, high)
    TokyoLowPrice    := math.min(TokyoLowPrice, low)
    box.set_top(TokyoBox, TokyoHighPrice)
    box.set_bottom(TokyoBox, TokyoLowPrice)
    box.set_right(TokyoBox, bar_index + 1)
    label.set_x(TokyoLabel, (box.get_left(TokyoBox)+box.get_right(TokyoBox))/2)
    label.set_y(TokyoLabel, TokyoHighPrice)
    if sessionOC
        line.set_x2(TokyoOC, bar_index)
        line.set_y2(TokyoOC, close)
    if halfline
        line.set_y1(TokyoLine, (TokyoHighPrice+TokyoLowPrice)/2)
        line.set_y2(TokyoLine, (TokyoHighPrice+TokyoLowPrice)/2)
        line.set_x2(TokyoLine, bar_index+1)
    if merge and not inLondon and showLondon
        TokyoHighM := TokyoHighPrice
        TokyoLowM  := TokyoLowPrice
    if merge and inLondon and showLondon
        box.set_top(TokyoBox, TokyoHighM)
        box.set_bottom(TokyoBox, TokyoLowM)
        label.set_y(TokyoLabel, TokyoHighM)
        box.set_right(TokyoBox, (box.get_left(LondonBox)))
        line.set_x2(TokyoLine, (box.get_left(LondonBox)))
        label.set_x(TokyoLabel, (box.get_left(TokyoBox)+box.get_right(TokyoBox))/2)
        line.set_x2(TokyoOC, (box.get_left(LondonBox)))
        line.set_y2(TokyoOC, LondonOpenPrice)
        line.set_y1(TokyoLine, (TokyoHighM+TokyoLowM)/2)
        line.set_y2(TokyoLine, (TokyoHighM+TokyoLowM)/2)
    var float pips = 0
    var float chg = 0
    pips := changeType=='Session High/Low' ? ((TokyoHighPrice - TokyoLowPrice) / syminfo.mintick / 10) : ((close - TokyoOpenPrice) / syminfo.mintick / 10)
    chg  := changeType=='Session Open/Close' ? (100 * (close - TokyoOpenPrice) / TokyoOpenPrice) : ((TokyoHighPrice - TokyoLowPrice) / TokyoLowPrice * 100)
    if percentChange and not pipChange
        label.set_text(TokyoLabel, str.tostring(TokyoText) + '  (' + str.tostring(chg, format.percent) + ')')
    if pipChange and not percentChange
        label.set_text(TokyoLabel, str.tostring(TokyoText) + '  (' + str.tostring(pips) + ')')
    if percentChange and pipChange
        label.set_text(TokyoLabel, str.tostring(TokyoText) + '  ('+ str.tostring(chg, format.percent)+ ' • ' + str.tostring(pips) + ')')
if inLondon and inRange
    LondonHighPrice  := math.max(LondonHighPrice, high)
    LondonLowPrice   := math.min(LondonLowPrice, low)
    box.set_top(LondonBox, LondonHighPrice)
    box.set_bottom(LondonBox, LondonLowPrice)
    box.set_right(LondonBox, bar_index+1)
    label.set_x(LondonLabel, (box.get_left(LondonBox)+box.get_right(LondonBox))/2)
    label.set_y(LondonLabel, LondonHighPrice)
    if sessionOC
        line.set_x2(LondonOC, bar_index)
        line.set_y2(LondonOC, close)
    if halfline
        line.set_y1(LondonLine, (LondonHighPrice+LondonLowPrice)/2)
        line.set_y2(LondonLine, (LondonHighPrice+LondonLowPrice)/2)
        line.set_x2(LondonLine, bar_index+1)
    if merge and not inNewYork and showNewYork
        LondonHighM := LondonHighPrice
        LondonLowM  := LondonLowPrice
    if merge and inNewYork and showNewYork
        box.set_top(LondonBox, LondonHighM)
        box.set_bottom(LondonBox, LondonLowM)
        label.set_y(LondonLabel, LondonHighM)
        box.set_right(LondonBox, (box.get_left(NewYorkBox)))
        line.set_x2(LondonLine, (box.get_left(NewYorkBox)))
        label.set_x(LondonLabel, (box.get_left(LondonBox)+box.get_right(LondonBox))/2)
        line.set_x2(LondonOC, (box.get_left(NewYorkBox)))
        line.set_y2(LondonOC, NewYorkOpenPrice)
        line.set_y1(LondonLine, (LondonHighM+LondonLowM)/2)
        line.set_y2(LondonLine, (LondonHighM+LondonLowM)/2)
    var float pips = 0
    var float chg = 0
    pips := changeType=='Session High/Low' ? ((LondonHighPrice - LondonLowPrice) / syminfo.mintick / 10) : ((close - LondonOpenPrice) / syminfo.mintick / 10)
    chg  := changeType=='Session Open/Close' ? (100 * (close - LondonOpenPrice) / LondonOpenPrice) : ((LondonHighPrice - LondonLowPrice) / LondonLowPrice * 100)
    if percentChange and not pipChange
        label.set_text(LondonLabel, str.tostring(LondonText) + '  (' + str.tostring(chg, format.percent) + ')')
    if pipChange and not percentChange
        label.set_text(LondonLabel, str.tostring(LondonText) + '  (' + str.tostring(pips) + ')')
    if percentChange and pipChange
        label.set_text(LondonLabel, str.tostring(LondonText) + '  ('+ str.tostring(chg, format.percent)+ ' • ' + str.tostring(pips) + ')')
if inNewYork and inRange
    NewYorkHighPrice  := math.max(NewYorkHighPrice, high)
    NewYorkLowPrice   := math.min(NewYorkLowPrice, low)
    box.set_top(NewYorkBox, NewYorkHighPrice)
    box.set_bottom(NewYorkBox, NewYorkLowPrice)
    box.set_right(NewYorkBox, bar_index + 1)
    label.set_x(NewYorkLabel, (box.get_left(NewYorkBox)+box.get_right(NewYorkBox))/2)
    label.set_y(NewYorkLabel, NewYorkHighPrice)
    if sessionOC
        line.set_x2(NewYorkOC, bar_index)
        line.set_y2(NewYorkOC, close)
    if halfline
        line.set_y1(NewYorkLine, (NewYorkHighPrice+NewYorkLowPrice)/2)
        line.set_y2(NewYorkLine, (NewYorkHighPrice+NewYorkLowPrice)/2)
        line.set_x2(NewYorkLine, bar_index+1)
    if merge and not inSydney and showSydney
        NewYorkHighM := NewYorkHighPrice
        NewYorkLowM  := NewYorkLowPrice
    if merge and inSydney and showSydney
        box.set_top(NewYorkBox, NewYorkHighM)
        box.set_bottom(NewYorkBox, NewYorkLowM)
        label.set_y(NewYorkLabel, NewYorkHighM)
        box.set_right(NewYorkBox, (box.get_left(SydneyBox)))
        line.set_x2(NewYorkLine, (box.get_left(SydneyBox)))
        label.set_x(NewYorkLabel, (box.get_left(NewYorkBox)+box.get_right(NewYorkBox))/2)
        line.set_x2(NewYorkOC, (box.get_left(SydneyBox)))
        line.set_y2(NewYorkOC, SydneyOpenPrice)
        line.set_y1(NewYorkLine, (NewYorkHighM+NewYorkLowM)/2)
        line.set_y2(NewYorkLine, (NewYorkHighM+NewYorkLowM)/2)
    var float pips = 0
    var float chg = 0
    pips := changeType=='Session High/Low' ? ((NewYorkHighPrice - NewYorkLowPrice) / syminfo.mintick / 10) : ((close - NewYorkOpenPrice) / syminfo.mintick / 10)
    chg  := changeType=='Session Open/Close' ? (100 * (close - NewYorkOpenPrice) / NewYorkOpenPrice) : ((NewYorkHighPrice - NewYorkLowPrice) / NewYorkLowPrice * 100)
    if percentChange and not pipChange
        label.set_text(NewYorkLabel, str.tostring(NewYorkText) + '  (' + str.tostring(chg, format.percent) + ')')
    if pipChange and not percentChange
        label.set_text(NewYorkLabel, str.tostring(NewYorkText) + '  (' + str.tostring(pips) + ')')
    if percentChange and pipChange
        label.set_text(NewYorkLabel, str.tostring(NewYorkText) + '  ('+ str.tostring(chg, format.percent)+ ' • ' + str.tostring(pips) + ')')
if inSydney and inRange
    SydneyHighPrice  := math.max(SydneyHighPrice, high)
    SydneyLowPrice   := math.min(SydneyLowPrice, low)
    box.set_top(SydneyBox, SydneyHighPrice)
    box.set_bottom(SydneyBox, SydneyLowPrice)
    box.set_right(SydneyBox, bar_index + 1)
    label.set_x(SydneyLabel, (box.get_left(SydneyBox)+box.get_right(SydneyBox))/2)
    label.set_y(SydneyLabel, SydneyHighPrice)
    if sessionOC
        line.set_x2(SydneyOC, bar_index)
        line.set_y2(SydneyOC, close)
    if halfline
        line.set_y1(SydneyLine, (SydneyHighPrice+SydneyLowPrice)/2)
        line.set_y2(SydneyLine, (SydneyHighPrice+SydneyLowPrice)/2)
        line.set_x2(SydneyLine, bar_index+1)
    if merge and not inTokyo and showTokyo
        SydneyHighM := SydneyHighPrice
        SydneyLowM  := SydneyLowPrice
    if merge and inTokyo and showTokyo
        box.set_top(SydneyBox, SydneyHighM)
        box.set_bottom(SydneyBox, SydneyLowM)
        label.set_y(SydneyLabel, SydneyHighM)
        box.set_right(SydneyBox, (box.get_left(TokyoBox)))
        line.set_x2(SydneyLine, (box.get_left(TokyoBox)))
        label.set_x(SydneyLabel, (box.get_left(SydneyBox)+box.get_right(SydneyBox))/2)
        line.set_x2(SydneyOC, (box.get_left(TokyoBox)))
        line.set_y2(SydneyOC, TokyoOpenPrice)
        line.set_y1(SydneyLine, (SydneyHighM+SydneyLowM)/2)
        line.set_y2(SydneyLine, (SydneyHighM+SydneyLowM)/2)
    var float pips = 0
    var float chg = 0
    pips := changeType=='Session High/Low' ? ((SydneyHighPrice - SydneyLowPrice) / syminfo.mintick / 10) : ((close - SydneyOpenPrice) / syminfo.mintick / 10)
    chg  := changeType=='Session Open/Close' ? (100 * (close - SydneyOpenPrice) / SydneyOpenPrice) : ((SydneyHighPrice - SydneyLowPrice) / SydneyLowPrice * 100)
    if percentChange and not pipChange
        label.set_text(SydneyLabel, str.tostring(SydneyText) + '  (' + str.tostring(chg, format.percent) + ')')
    if pipChange and not percentChange
        label.set_text(SydneyLabel, str.tostring(SydneyText) + '  (' + str.tostring(pips) + ')')
    if percentChange and pipChange
        label.set_text(SydneyLabel, str.tostring(SydneyText) + '  ('+ str.tostring(chg, format.percent)+ ' • ' + str.tostring(pips) + ')')

// Coloring candles
TKLO = showLondon  ? (not inLondon)  : true
LONY = showNewYork ? (not inNewYork) : true
NYSY = showSydney  ? (not inSydney)  : true
SYTK = showTokyo   ? (not inTokyo)   : true
barcolor((colorcandles or displayType=='Candles') and not merge and  showTokyo   and inTokyo   and inRange          ? color.new(TokyoCol, 40) : na, editable = false)
barcolor((colorcandles or displayType=='Candles') and not merge and  showLondon  and inLondon  and inRange          ? color.new(LondonCol, 40) : na, editable = false)
barcolor((colorcandles or displayType=='Candles') and not merge and  showNewYork and inNewYork and inRange          ? color.new(NewYorkCol, 40) : na, editable = false)
barcolor((colorcandles or displayType=='Candles') and not merge and  showSydney  and inNewYork and inRange          ? color.new(SydneyCol, 40) : na, editable = false)
barcolor((colorcandles or displayType=='Candles') and merge     and  showTokyo   and inTokyo   and TKLO and inRange ? color.new(TokyoCol, 40) : na, editable = false)
barcolor((colorcandles or displayType=='Candles') and merge     and  showLondon  and inLondon  and LONY and inRange ? color.new(LondonCol, 40) : na, editable = false)
barcolor((colorcandles or displayType=='Candles') and merge     and  showNewYork and inNewYork and NYSY and inRange ? color.new(NewYorkCol, 40) : na, editable = false)
barcolor((colorcandles or displayType=='Candles') and merge     and  showSydney  and inSydney  and SYTK and inRange ? color.new(SydneyCol, 40) : na, editable = false)

// Coloring background if displayType=='Zones'
TokyoT              = time(timeframe.period, TokyoTime)
LondonT             = time(timeframe.period, LondonTime)
NewYorkT            = time(timeframe.period, NewYorkTime)
SydneyT             = time(timeframe.period, SydneyTime)
bgcolor(displayType == 'Zones' and not merge and showTokyo   and inRange and  time == TokyoT   ? TokyoCol   : na, editable = false)
bgcolor(displayType == 'Zones' and not merge and showLondon  and inRange and  time == LondonT  ? LondonCol  : na, editable = false)
bgcolor(displayType == 'Zones' and not merge and showNewYork and inRange and  time == NewYorkT ? NewYorkCol : na, editable = false)
bgcolor(displayType == 'Zones' and not merge and showSydney  and inRange and  time == SydneyT  ? SydneyCol  : na, editable = false)
bgcolor(displayType == 'Zones' and merge and not inLondon  and showTokyo   and inRange and  time == TokyoT   ? TokyoCol   : na, editable = false)
bgcolor(displayType == 'Zones' and merge and not inNewYork and showLondon  and inRange and  time == LondonT  ? LondonCol  : na, editable = false)
bgcolor(displayType == 'Zones' and merge and not inSydney  and showNewYork and inRange and  time == NewYorkT ? NewYorkCol : na, editable = false)
bgcolor(displayType == 'Zones' and merge and not inTokyo   and showSydney  and inRange and  time == SydneyT  ? SydneyCol  : na, editable = false)

// Plotting sessions in Timeline form
plotshape(displayType=='Timeline' and (merge and showLondon  ? (showTokyo   and inTokyo   and not inLondon)  : showTokyo   and inTokyo),   style=shape.square, color=TokyoCol,   location = location.bottom, size=size.auto)
plotshape(displayType=='Timeline' and (merge and showNewYork ? (showLondon  and inLondon  and not inNewYork) : showLondon  and inLondon),  style=shape.square, color=LondonCol,  location = location.bottom, size=size.auto)
plotshape(displayType=='Timeline' and (merge and showSydney  ? (showNewYork and inNewYork and not inSydney)  : showNewYork and inNewYork), style=shape.square, color=NewYorkCol, location = location.bottom, size=size.auto)
plotshape(displayType=='Timeline' and (merge and showTokyo   ? (showSydney  and inSydney  and not inTokyo)   : showSydney  and inSydney),  style=shape.square, color=SydneyCol,  location = location.bottom, size=size.auto)

// Creating alerts
alertcondition(inTokyo   and not inTokyo[1], 'Tokyo Open', 'The Tokyo Session has started')
alertcondition(inLondon  and not inLondon[1], 'London Open', 'The London Session has started')
alertcondition(inNewYork and not inNewYork[1], 'New York Open', 'The New York Session has started')
alertcondition(inSydney  and not inSydney[1], 'Sydney Open', 'The Sydney Session has started')
alertcondition(high > TokyoHighPrice[0]    and inTokyo, 'Tokyo Session - New High', 'New High in Tokyo Session')
alertcondition(high > LondonHighPrice[0]   and inLondon, 'London Session - New High', 'New High in London Session')
alertcondition(high > NewYorkHighPrice[0]  and inNewYork, 'New York Session - New High', 'New High in New York Session')
alertcondition(high > SydneyHighPrice[0]   and inSydney, 'Sydney Session - New High', 'New High in Sydney Session')
alertcondition(low  > TokyoLowPrice[0]     and inTokyo, 'Tokyo Session - New Low', 'New Low in Tokyo Session')
alertcondition(low  > LondonLowPrice[0]    and inLondon, 'London Session - New Low', 'New Low in London Session')
alertcondition(low  > NewYorkLowPrice[0]   and inNewYork, 'New York Session - New Low', 'New Low In New York Session')
alertcondition(low  > SydneyLowPrice[0]    and inSydney, 'Sydney Session - New Low', 'New Low In Sydney Session')
Laporan Volatiliti Harian
Day of Week - Volatility Report
Kod program:
Pine Script
Pengenalan:
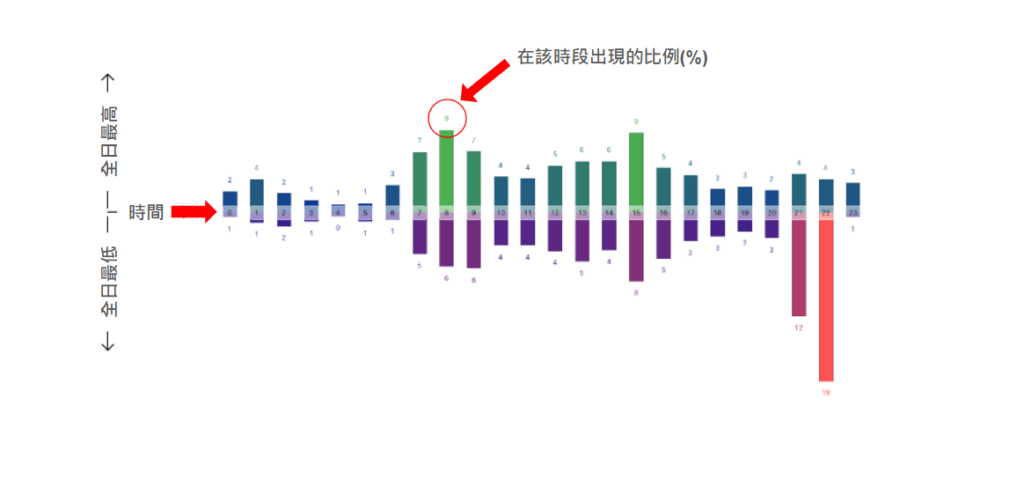
Penunjuk menganalisis turun naik dan melaporkan statistik mengikut hari dalam minggu.
Konsep:
Peserta pasaran yang berbeza mengambil bahagian dalam sesi dagangan yang berbeza. Bagaimanakah ini mempengaruhi pasaran sepanjang minggu?
Berikut ialah beberapa idea untuk diterokai:
Hari dalam minggu manakah pasaran paling tidak menentu?
Tetapkan stop profit dan stop loss dengan merujuk kepada turun naik hari itu.
Adakah terdapat situasi yang bertepatan dengan hari dagangan kemenangan tertinggi?
Apakah hari dalam seminggu anda patut berhenti berdagang?
Soalan-soalan ini melibatkan faktor kompleks peserta pasaran dan keadaan pasaran dan mungkin memerlukan analisis data dan penyelidikan lanjut untuk mendapatkan jawapan yang kukuh. Strategi perdagangan yang berbeza dan selera risiko juga boleh membawa kepada keputusan yang berbeza. Adalah disyorkan agar anda memahami isu-isu ini melalui penyelidikan yang mendalam dan ujian belakang untuk menentukan hari dagangan terbaik untuk strategi dagangan anda.
// This source code is subject to the terms of the Mozilla Public License 2.0 at https://mozilla.org/MPL/2.0/
// © 1uptick
// Last modified: 2023-11-15
// Version 2.0


//@version=5
indicator("Tops & Bottoms - Time of Day Report", format = format.percent, max_labels_count = 72)


//--------------------------------------------------------------------
//#region                      Constants
//--------------------------------------------------------------------

int             COLUMN_WIDTH                = 2
int             COLUMN_GAP                  = 2
color           COLUMN_BORDERCOLOR          = color.new(chart.fg_color, 80)
color           COLUMN_TOP_MAX_COLOR        = color.green
color           COLUMN_TOP_MIN_COLOR        = #0c3299
color           COLUMN_BOTTOM_MAX_COLOR     = color.red
color           COLUMN_BOTTOM_MIN_COLOR     = #311b92
color           CATEGORY_LABEL_BGCOLOR      = color.new(chart.bg_color, 50)
color           CATEGORY_LABEL_TEXTCOLOR    = chart.fg_color
array<string>   TIMEFRAMES                  = array.from("15", "30", "60")

//#endregion


//--------------------------------------------------------------------
//#region                        Inputs
//--------------------------------------------------------------------

timezoneTooltip     = "Exchange and geographical timezones may observe Daylight Saving Time (DST)."
sessionTooltip      = "By default, the indicator identifies the top and bottom over the symbol's session. " +
                      "You can specify your custom session (in the indicator's timezone)."
noticeTitle         = "Navigate to the 1-hour timeframe (30-minute timeframe if the market starts at 𝑥:30 AM or " +
                      "15-minute timeframe if 𝑥:15 AM) for the indicator to analyze the bars and collect tops and bottoms."

timezoneInput       = input.string  ("Exchange", "Timezone",
     [
     "UTC",
     "Exchange",
     "Africa/Cairo",
     "Africa/Johannesburg",
     "Africa/Lagos",
     "Africa/Nairobi",
     "Africa/Tunis",
     "America/Argentina/Buenos_Aires",
     "America/Bogota",
     "America/Caracas",
     "America/Chicago",
     "America/Denver",
     "America/El_Salvador",
     "America/Juneau",
     "America/Lima",
     "America/Los_Angeles",
     "America/New_York",
     "America/Mexico_City",
     "America/Phoenix",
     "America/Santiago",
     "America/Sao_Paulo",
     "America/Toronto",
     "America/Vancouver",
     "Asia/Almaty",
     "Asia/Ashgabat",
     "Asia/Bahrain",
     "Asia/Bangkok",
     "Asia/Dubai",
     "Asia/Chongqing",
     "Asia/Colombo",
     "Asia/Ho_Chi_Minh",
     "Asia/Hong_Kong",
     "Asia/Istanbul",
     "Asia/Jakarta",
     "Asia/Jerusalem",
     "Asia/Karachi",
     "Asia/Kathmandu",
     "Asia/Kolkata",
     "Asia/Kuwait",
     "Asia/Manila",
     "Asia/Muscat",
     "Asia/Nicosia",
     "Asia/Qatar",
     "Asia/Riyadh",
     "Asia/Seoul",
     "Asia/Shanghai",
     "Asia/Singapore",
     "Asia/Taipei",
     "Asia/Tehran",
     "Asia/Tokyo",
     "Asia/Yangon",
     "Atlantic/Reykjavik",
     "Australia/Adelaide",
     "Australia/Brisbane",
     "Australia/Perth",
     "Australia/Sydney",
     "Europe/Amsterdam",
     "Europe/Athens",
     "Europe/Belgrade",
     "Europe/Berlin",
     "Europe/Bratislava",
     "Europe/Brussels",
     "Europe/Bucharest",
     "Europe/Budapest",
     "Europe/Copenhagen",
     "Europe/Dublin",
     "Europe/Helsinki",
     "Europe/Madrid",
     "Europe/Malta",
     "Europe/Moscow",
     "Europe/Lisbon",
     "Europe/London",
     "Europe/Luxembourg",
     "Europe/Oslo",
     "Europe/Paris",
     "Europe/Riga",
     "Europe/Rome",
     "Europe/Stockholm",
     "Europe/Tallinn",
     "Europe/Vilnius",
     "Europe/Warsaw",
     "Europe/Zurich",
     "Pacific/Auckland",
     "Pacific/Chatham",
     "Pacific/Fakaofo",
     "Pacific/Honolulu",
     "Pacific/Norfolk"
     ],
     timezoneTooltip,
     display = display.none
 )
customSessionInput  = input.bool    (false, "Custom Session", inline = "Session")
sessionInput        = input.session ("0000-0000", "", tooltip = sessionTooltip, inline = "Session", display = display.none)
sessionTypeInput    = input.string  ("All", "Session", ["All", "Up", "Down"], group = "Filters")
startDateInput      = input.time    (timestamp("01 Jan 1975"), "From", group = "Filters")
endDateInput        = input.time    (timestamp("31 Dec 2050"), "To", group = "Filters")
noticeInput         = input.bool    (true, noticeTitle, group = "How To Use?", confirm = true, display = display.none)

//#endregion


//--------------------------------------------------------------------
//#region                         Types
//--------------------------------------------------------------------

type Marker
    float price = na
    int   time  = na

//#endregion


//--------------------------------------------------------------------
//#region                 Variables declarations
//--------------------------------------------------------------------

var topsByHourMap       = map.new<int, int>()
var bottomsByHourMap    = map.new<int, int>()
var openTimesByHourMap  = map.new<int, string>()
var closeTimesByHourMap = map.new<int, string>()
var top                 = Marker.new()
var bottom              = Marker.new()

//#endregion


//--------------------------------------------------------------------
//#region                   Functions & methods
//--------------------------------------------------------------------

// @function Produce the timezone parameter from the user-selected setting.
// @returns  (string) Timezone
getTimezone() =>
    var _tz = switch timezoneInput
        "UTC"       => "UTC+0"
        "Exchange"  => syminfo.timezone
        => timezoneInput


// @function Get the hour in the user-selected timezone from a given UNIX time.
// @returns  (int) Hour
getHour(int barTime) =>
    hour(barTime, getTimezone())


// @function Get the color based on a gradient between the minimum and maximum values.
// @returns  color
getGradientColor(float value, float minValue, float maxValue, color minColor, color maxColor) =>
    // When `minValue` and `maxValue` are identical (on the first collected values), return the mid gradient color instead of no color.
    minValue != maxValue ? color.from_gradient(value, minValue, maxValue, minColor, maxColor) : color.from_gradient(0.5, 0, 1, minColor, maxColor)


// @function Draw the columns for a given hour.
// @returns  void
drawHourlyColumns(int key) =>
    var _upperColumnBox = box.new(na, na, na, na, COLUMN_BORDERCOLOR)
    var _lowerColumnBox = box.new(na, na, na, na, COLUMN_BORDERCOLOR)
    var _upperDataLabel = label.new(na, na, color = color(na), style = label.style_label_down)
    var _lowerDataLabel = label.new(na, na, color = color(na), style = label.style_label_up)
    var _categoryLabel  = label.new(na, na, color = CATEGORY_LABEL_BGCOLOR, style = label.style_label_center, textcolor = CATEGORY_LABEL_TEXTCOLOR)
    var _gridMultiplier = COLUMN_WIDTH + COLUMN_GAP

    if barstate.islast
        _topsArray      = topsByHourMap.values()
        _bottomsArray   = bottomsByHourMap.values()

        // Sum the number of data sampled.
        _dataSum        = _topsArray.sum()


        // Calculate the shares of occurrence of tops and bottoms.

        _top            = topsByHourMap.get(key)
        _bottom         = bottomsByHourMap.get(key)
        _topY           = nz(_top       / _dataSum * 100)
        _bottomY        = nz(_bottom    / _dataSum * 100)


        // Get the coordinates for plotting the columns chart (on the left or right side of the last bar, given enough space).

        _hasSpace       = bar_index - 24 * _gridMultiplier > 0
        _x1             = _hasSpace ? bar_index + (key - 24) * _gridMultiplier : bar_index + key * _gridMultiplier
        _x2             = _x1 + COLUMN_WIDTH
        _center         = _x1 + COLUMN_WIDTH / 2


        // Get the coloring of the columns and data labels.

        _topsMin        = _topsArray.min()      / _dataSum * 100
        _topsMax        = _topsArray.max()      / _dataSum * 100
        _bottomsMin     = _bottomsArray.min()   / _dataSum * 100
        _bottomsMax     = _bottomsArray.max()   / _dataSum * 100
        _topColor       = getGradientColor(_topY, _topsMin, _topsMax, COLUMN_TOP_MIN_COLOR, COLUMN_TOP_MAX_COLOR)
        _bottomColor    = getGradientColor(_bottomY, _bottomsMin, _bottomsMax, COLUMN_BOTTOM_MIN_COLOR, COLUMN_BOTTOM_MAX_COLOR)


        // Plot the upper and lower columns for tops and bottoms.

        _upperColumnBox.set_lefttop     (_x1, _topY)
        _upperColumnBox.set_rightbottom (_x2, 0)
        _upperColumnBox.set_bgcolor     (_topColor)

        _lowerColumnBox.set_lefttop     (_x1, 0)
        _lowerColumnBox.set_rightbottom (_x2, -_bottomY)
        _lowerColumnBox.set_bgcolor     (_bottomColor)


        // Plot the X-axis category label.

        _openTime                   = openTimesByHourMap.get(key)
        _closeTime                  = closeTimesByHourMap.get(key)
        _isCategoryDefined          = not (na(_openTime) or na(_closeTime))

        _categoryLabel.set_xy       (_center, 0)
        _categoryLabel.set_text     (str.tostring(key))
        _categoryLabel.set_tooltip  (_isCategoryDefined ? str.format("{0} to {1} ({2})", _openTime, _closeTime, getTimezone()) : "Not Collected")


        // Plot the data labels for tops and bottoms.

        if not na(_top)
            _upperDataLabel.set_xy          (_center, _topY)
            _upperDataLabel.set_text        (str.tostring(math.round(_topY)))
            _upperDataLabel.set_textcolor   (_topColor)
            _upperDataLabel.set_tooltip     (str.format("{0} based on {1} sampled days", str.tostring(_topY, format.percent), _dataSum))

        if not na(_bottom)
            _lowerDataLabel.set_xy          (_center, -_bottomY)
            _lowerDataLabel.set_text        (str.tostring(math.round(_bottomY)))
            _lowerDataLabel.set_textcolor   (_bottomColor)
            _lowerDataLabel.set_tooltip     (str.format("{0} based on {1} sampled days", str.tostring(_bottomY, format.percent), _dataSum))


// @function Check if the day/custom session matches the user-selected session type filter.
// @returns  bool
isValidSessionType(start, end) =>
    var float _open = na
    bool _isValid   = na

    if start
        _open := open

    if end
        _isValid := switch sessionTypeInput
            "All"   => not na(_open[1])
            "Up"    => close[1] > _open[1]
            "Down"  => close[1] < _open[1]

    _isValid


// @function Check if the current bar time is in the user-selected time range filter.
// @returns  bool
isInTimeRange() =>
    time >= startDateInput and time <= endDateInput


// @function Produce the UNIX time of the current date at a specified time in the user-selected timezone.
// @returns  (int) UNIX time
getTime(int h, int m) =>
    timestamp(getTimezone(), year, month, dayofmonth, h, m, second)


// @function Get the current day's session dates from a given session string.
// @returns  ([int, int]) Start and end UNIX time
getSessionTimes(sessionString) =>
    [getTime(int(str.tonumber(str.substring(sessionString, 0, 2))), int(str.tonumber(str.substring(sessionString, 2, 4)))),
     getTime(int(str.tonumber(str.substring(sessionString, 5, 7))), int(str.tonumber(str.substring(sessionString, 7))))]


// @function Detect changes in the day/custom session and if the current bar is in the session.
// @returns  [bool, bool, bool]
sessionChange() =>
    if customSessionInput
        var int _startTime = na
        var int _endTime = na
        _isInSession = not na(time(timeframe.period, sessionInput, getTimezone()))
        [_currentStartTime, _currentEndTime] = getSessionTimes(sessionInput)

        // On overnight sessions (e.g., EURUSD), preserve original start and end times.
        _startTime := time >= _currentStartTime ? _currentStartTime : _startTime
        _endTime := time >= _currentEndTime ? _currentEndTime : _endTime

        // Start on the first bar of the session.
        _start = ta.change(_startTime) > 0 and _isInSession

        // End after the last bar of the session.
        _end = ta.change(_endTime) > 0 and _isInSession[1]

        [_start, _end, _isInSession]
    else
        // Start and end on the day change.
        _dayChange = timeframe.change("D")

        [_dayChange, _dayChange, true]

//#endregion


//--------------------------------------------------------------------
//#region                         Logic
//--------------------------------------------------------------------

if TIMEFRAMES.indexof(timeframe.period) == -1
    runtime.error("The report can not compute data on the chart's timeframe. Please navigate to the 1-hour, 30-minute, or 15-minute timeframe.")

//@variable Is true when the current bar is inside the time range filter.
isInRange = isInTimeRange()

// Session variables from the day/custom session.
[sessionStart, sessionEnd, isInSession] = sessionChange()

// @variable Is true when the day/custom session closes per the session type filter.
isValidType = isValidSessionType(sessionStart, sessionEnd)


// Track the top and bottom of the day/custom session.

if isInRange

    // Reset the top and bottom on the first bar of a new day/custom session.

    if sessionStart
        top.price       := na
        top.time        := na
        bottom.price    := na
        bottom.time     := na


    // Track the top and bottom.

    if na(top.price) or high > top.price
        top.price       := high
        top.time        := time

    if na(bottom.price) or low < bottom.price
        bottom.price    := low
        bottom.time     := time


// Collect the top, bottom, and time data.

if isInRange and barstate.isconfirmed
    // @variable Is true on the first bar of the time range.
    _isFirstBar = na(top.time[1]) or na(bottom.time[1])


    // Collect the top and bottom on matching type on a day/custom session change.

    if isValidType and not _isFirstBar
        _topHour     = getHour(top.time[1])
        _bottomHour  = getHour(bottom.time[1])

        _topCount    = nz(topsByHourMap.get(_topHour)) +1
        _bottomCount = nz(bottomsByHourMap.get(_bottomHour)) +1

        topsByHourMap.put   (_topHour,    _topCount)
        bottomsByHourMap.put(_bottomHour, _bottomCount)

        log.info("\n▲ Top at {0} ({1}/{4})\n▼ Bottom at {2} ({3}/{4})", _topHour, _topCount, _bottomHour, _bottomCount, topsByHourMap.values().sum())


    // Collect the hourly opening and closing times
    // On hourly time change, collect the open time and preceding close time.
    // The times are be displayed in the tooltips of category labels.

    _barHour     = getHour(time)
    _prevBarHour = getHour(time[1])

    if _prevBarHour != _barHour
        openTimesByHourMap.put (_barHour,     str.format_time(time, "HH:mm", getTimezone()))
        closeTimesByHourMap.put(_prevBarHour, str.format_time(time_close[1], "HH:mm", getTimezone()))

//#endregion


//--------------------------------------------------------------------
//#region                        Visuals
//--------------------------------------------------------------------

drawHourlyColumns(0)
drawHourlyColumns(1)
drawHourlyColumns(2)
drawHourlyColumns(3)
drawHourlyColumns(4)
drawHourlyColumns(5)
drawHourlyColumns(6)
drawHourlyColumns(7)
drawHourlyColumns(8)
drawHourlyColumns(9)
drawHourlyColumns(10)
drawHourlyColumns(11)
drawHourlyColumns(12)
drawHourlyColumns(13)
drawHourlyColumns(14)
drawHourlyColumns(15)
drawHourlyColumns(16)
drawHourlyColumns(17)
drawHourlyColumns(18)
drawHourlyColumns(19)
drawHourlyColumns(20)
drawHourlyColumns(21)
drawHourlyColumns(22)
drawHourlyColumns(23)

//#endregion
Sokongan dan rintangan carta
Support and Resistnace
Kod program:
Pine Script
Pengenalan:
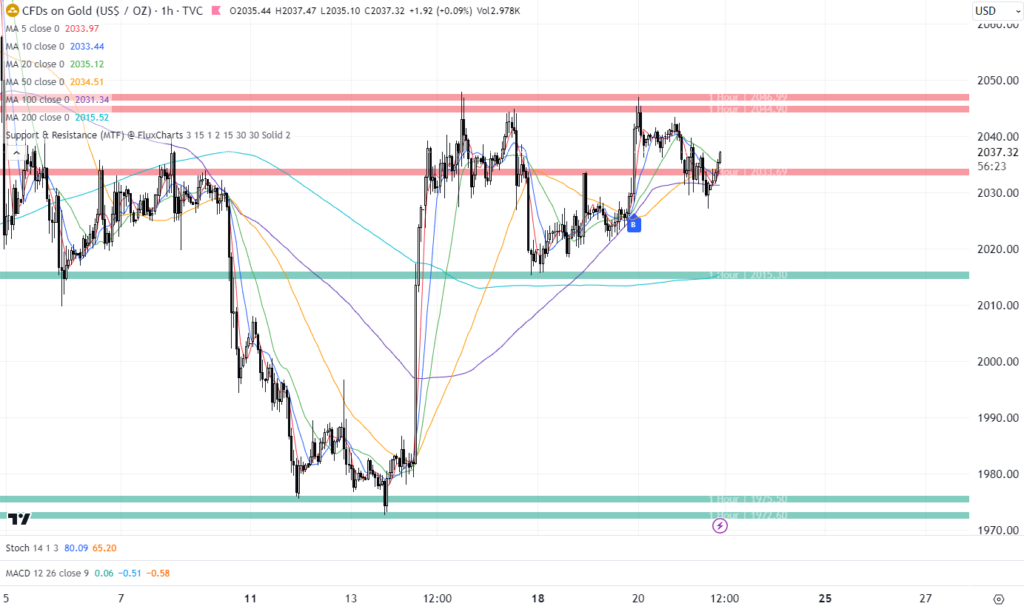
Revolusikan pengalaman dagangan anda di TradingView! Alat ini berfungsi pada tiga rangka masa yang berbeza, memberikan pandangan menyeluruh tentang dinamik pasaran, mengenal pasti rintangan dan sokongan pada carta, dan membantu anda membuat keputusan perdagangan termaklum.
// This Pine Script™ code is subject to the terms of the Mozilla Public License 2.0 at https://mozilla.org/MPL/2.0/
// @1uptick
//@version=5
const bool DEBUG = false
indicator("1up Support & Resistance", overlay = true, max_labels_count = 100, max_lines_count = 100, max_boxes_count = 100, max_bars_back = 305)
const int timeframeCount = 3
const float labelOffsetsY = 1.001
const int labelOffsetsXIndex = 30
const float epsilon = 0.001
const float retestEpsilon = 0.002
const int maxPivotsBackSR = 15
const int retestLabelEveryXBars = 4
const int maxTraverse = 200 // Affects bar history limit. Default value 200.
const int maxRetestLabels = 25
const int maxSupports = 3
const int maxResistances = 3
const float retestPriceDifferencePercentMax = 0.02
const bool calculateTimeSkipMS = false
const int debug_maxPivotLabels = 25
// _____ INPUTS _____
resistanceSupportCount = input.int(3, "Support & Resistance Count", options = [1, 2, 3], group = "General Configuration")
pivotRange = input.int(15, "Pivot Range", options = [5, 15, 30], tooltip = "Increase for more general pivots, decrease for more private pivots.", group = "General Configuration")
strength = input.int(1, "Strength", options = [1, 2, 3, 4], tooltip = "X many times price touched relative price area in order to be considered a support/resistance zone.", group = "General Configuration")
expandLines = input.bool(true,"Expand Lines & Zones", group = "General Configuration")
enableZones = input.bool(false, "Enable Zones", group = "Support & Resistance Zones")
zoneWidth = input.int(1, "Zone Width", options = [1,2,3], group = "Support & Resistance Zones")
timeframe1Enabled = input.bool(true, title = "", group = "Timeframes", inline = "timeframe1")
timeframe1 = input.timeframe("", title = "", group = "Timeframes", inline = "timeframe1")
timeframe2Enabled = input.bool(false, title = "", group = "Timeframes", inline = "timeframe2")
timeframe2 = input.timeframe("15", title = "", group = "Timeframes", inline = "timeframe2")
timeframe3Enabled = input.bool(false, title = "", group = "Timeframes", inline = "timeframe3")
timeframe3 = input.timeframe("30", title = "", group = "Timeframes", inline = "timeframe3")
showBreaks = input.bool(true,"Show Breaks", group = "Breaks & Retests", inline = "ShowBR")
showRetests = input.bool(true,"Show Retests", group = "Breaks & Retests", inline = "ShowBR")
avoidFalseBreaks = input.bool(true,"Avoid False Breaks", group = "Breaks & Retests")
falseBreakoutVolumeThreshold = input.int(30, "Break Volume Threshold %", minval = 0, maxval = 100, group = "Breaks & Retests", tooltip = "Only taken into account if Avoid False Breakouts is enabled.\nHigher values mean it's less likely to be a break.")
inverseBrokenLineColor = input.bool(false,"Inverse Color After Broken", tooltip = "Needs Show Breaks & Expand Lines option enabled.", group = "Breaks & Retests")
lineStyle = input.string("Solid", "Line Style", ["Solid", "Dashed", "Dotted"], group = "Style")
lineWidth = input.int(2, "Line Width", minval = 1, group = "Style")
supportColor = input.color(#08998180, "Support Color", group = "Style", inline = "RScolors")
resistanceColor = input.color(#f2364580, "Resistance Color", group = "Style", inline = "RScolors")
textColor = input.color(#ffffff80, "Text Color", group = "Style", inline = "RScolors")
enableRetestAlerts = input.bool(true, "Enable Retest Alerts", tooltip = "Needs Show Retests option enabled.", group = "Alerts")
enableBreakAlerts = input.bool(true, "Enable Break Alerts", group = "Alerts")
memoryOptimizatonEnabled = input.bool(false, "Enable Memory Optimization", tooltip = "Enable this option if you encounter memory errors.", group = "Advanced")
// _____ INPUTS END _____
// _____ DEBUG OPTIONS _____
debug_labelPivots = not DEBUG ? "None" : input.string("None", title = "[DBG] Label Pivots", group = "DEBUG", options = ["All", "RS", "None"], tooltip = "All -> Debugs all pivot labels.\nRS -> Debugs RS pivot labels.\nNone -> Debugs none of the last R&S pivots.")
debug_pivotLabelText = not DEBUG ? false : input.bool(false, title = "[DBG] Pivot Label Text", group = "DEBUG")
debug_showBrokenOnLabel = not DEBUG ? false : input.bool(false, "[DBG] Show Broken Text On Label", group = "DEBUG")
debug_removeDuplicateRS = not DEBUG ? true : input.bool(true, "[DBG] Remove Duplicate RS", group = "DEBUG")
debug_lastXResistances = not DEBUG ? 3 : input.int(3, "[DBG] Show Last X Resistances", minval = 0, maxval = maxResistances, group = "DEBUG")
debug_lastXSupports = not DEBUG ? 3 : input.int(3, "[DBG] Show Last X Supports", minval = 0, maxval = maxSupports, group = "DEBUG")
debug_enabledHistory = not DEBUG ? true : input.bool(true, "[DBG] Enable History", group = "DEBUG")
debug_maxHistoryRecords = not DEBUG ? 10 : input.int(10, "[DBG] Max History Records", options = [1, 2, 5, 10, 25], group = "DEBUG")
// _____ DEBUG OPTIONS END _____
createRSLine (color) =>
line.new(na, na, na, na, extend = expandLines ? extend.both : extend.none, xloc=xloc.bar_time, color = color, width = lineWidth, style = lineStyle == "Dashed" ? line.style_dashed : lineStyle == "Dotted" ? line.style_dotted : line.style_solid)
createRSBox (color, xlocType) =>
box.new(na, na, na, na, text_size = size.normal, xloc = xlocType, extend = extend.both, bgcolor = color, text_color = textColor, text_halign = expandLines ? text.align_right : text.align_center, border_color = #00000000)
createRSLabel () =>
label.new(na, na, "", style = label.style_none, textcolor = textColor)
createBreakLabel (RSType) =>
label.new(na,na,"B",style = RSType == "Resistance" ? label.style_label_up : label.style_label_down, color=color.blue, textcolor = color.white, xloc = xloc.bar_time, size = size.small)
createRetestLabel (RSType) =>
label.new(na,na,"R",style = RSType == "Resistance" ? label.style_label_down : label.style_label_up, color = RSType == "Resistance" ? resistanceColor : supportColor, textcolor = color.white, xloc = xloc.bar_time, size = size.small)
moveLine(_line, _x, _y, _x2) =>
line.set_xy1(_line, _x, _y)
line.set_xy2(_line, _x2, _y)
moveBox (_box, _topLeftX, _topLeftY, _bottomRightX, _bottomRightY) =>
box.set_lefttop(_box, _topLeftX, _topLeftY)
box.set_rightbottom(_box, _bottomRightX, _bottomRightY)
moveRSInfoBox (_box, _startPointX, _price, _endPointX) =>
zoneWidthPercent = zoneWidth == 1 ? 0.05 : zoneWidth == 2 ? 0.06 : 0.075
topY = _price * (1.0 + (zoneWidthPercent / 2.0 / 100.0))
bottomY = _price * (1.0 - (zoneWidthPercent / 2.0 / 100.0))
moveBox(_box, _startPointX, topY, _endPointX, bottomY)
// _____ TYPES _____
type RSInfo
bool isBroken = na
int brokenTime = na
string RSType = na
float price = na
line line = na
box box = na
label priceLabel = na
chart.point[] points = na
label[] debugPoints = na
label breakLabel = na
label[] retestLabels = na
line breakLine = na
box breakBox = na
newRSInfo (RSType) =>
newRSInfo = RSInfo.new()
newRSInfo.RSType := RSType
newRSInfo.price := na
newRSInfo.isBroken := false
newRSInfo.brokenTime := na
newRSInfo.line := enableZones ? na : createRSLine(RSType == "Resistance" ? resistanceColor : supportColor)
newRSInfo.box := enableZones ? createRSBox(RSType == "Resistance" ? resistanceColor : supportColor, xloc.bar_time) : na
newRSInfo.priceLabel := enableZones ? na : createRSLabel()
newRSInfo.points := array.new<chart.point>(0)
newRSInfo.debugPoints := array.new<label>(0)
newRSInfo.retestLabels := array.new<label>(0)
newRSInfo.breakLabel := na
newRSInfo.breakLine := na
newRSInfo.breakBox := na
newRSInfo
histRSInfo (RSInfo RSInfoF) =>
RSType = RSInfoF.RSType
newRS = RSInfo.new()
newRS.RSType := RSType
newRS.price := RSInfoF.price
newRS.debugPoints := array.new<label>(0)
newRS.retestLabels := array.new<label>(0)
newRS.points := array.new<chart.point>(0)
histText = "History | " + str.tostring(newRS.price, format.mintick)
startTime = math.min(time, RSInfoF.points.get(strength - 1).time)
endTime = RSInfoF.isBroken ? RSInfoF.brokenTime : time
if enableZones
newRS.box := createRSBox(RSType == "Resistance" ? resistanceColor : supportColor, xloc.bar_time)
moveRSInfoBox(newRS.box, startTime, newRS.price, endTime)
box.set_extend(newRS.box, expandLines ? extend.both : extend.none)
box.set_text(newRS.box, histText)
else
newRS.line := line.copy(RSInfoF.line)
moveLine(newRS.line, startTime, newRS.price, endTime)
line.set_extend(newRS.line, expandLines ? extend.both : extend.none)
newRS.priceLabel := label.copy(RSInfoF.priceLabel)
label.set_text(newRS.priceLabel, histText)
label.set_xloc(newRS.priceLabel, (startTime + endTime) / 2, xloc.bar_time)
if not na(newRS.breakLabel)
newRS.breakLabel := label.copy(RSInfoF.breakLabel)
newRS
safeDeleteRSInfo (RSInfo RSInfoF) =>
if not na(RSInfoF)
line.delete(RSInfoF.line)
box.delete(RSInfoF.box)
label.delete(RSInfoF.priceLabel)
RSInfoF.points.clear()
if RSInfoF.debugPoints.size() > 0
for i = 0 to RSInfoF.debugPoints.size() - 1
label.delete(RSInfoF.debugPoints.get(i))
RSInfoF.debugPoints.clear()
if RSInfoF.retestLabels.size() > 0
for i = 0 to RSInfoF.retestLabels.size() - 1
label.delete(RSInfoF.retestLabels.get(i))
RSInfoF.retestLabels.clear()
label.delete(RSInfoF.breakLabel)
line.delete(RSInfoF.breakLine)
box.delete(RSInfoF.breakBox)
type timeframeInfo
int index = na
string timeframeStr = na
bool isEnabled = false
RSInfo[] resistances = na
RSInfo[] supports = na
float[] highPivots = na
int[] highTimes = na
float[] lowPivots = na
int[] lowTimes = na
newTimeframeInfo (index, timeframeStr, isEnabled) =>
newTFInfo = timeframeInfo.new()
newTFInfo.index := index
newTFInfo.isEnabled := isEnabled
newTFInfo.timeframeStr := timeframeStr
newTFInfo.resistances := array.new<RSInfo>(debug_lastXResistances)
newTFInfo.supports := array.new<RSInfo>(debug_lastXSupports)
newTFInfo.highPivots := array.new<float>()
newTFInfo.highTimes := array.new<int>()
newTFInfo.lowPivots := array.new<float>()
newTFInfo.lowTimes := array.new<int>()
newTFInfo
// _____ TYPES END _____
// _____ VARS _____
var timeframeInfo[] timeframeInfos = array.from(newTimeframeInfo(1, timeframe1, timeframe1Enabled), newTimeframeInfo(2, timeframe2, timeframe2Enabled), newTimeframeInfo(3, timeframe3, timeframe3Enabled))
var bool initRun = true
var int maxTimeskipMS = 0
var float[] allLowPivots = array.new<float>(0)
var float[] allHighPivots = array.new<float>(0)
var int[] allLowTimes = array.new<int>(0)
var int[] allHighTimes = array.new<int>(0)
var RSInfo[] history = array.new<RSInfo>(0)
RSInfo[] curRSList = array.new<RSInfo>(0)
RSInfo[] oldRSList = array.new<RSInfo>(0)
int maxPivotsAllowed = memoryOptimizatonEnabled ? 10 : 15 // Affects memory limit. Default value 30.
// _____ VARS END _____
doValuesTouch (float value1, float value2) =>
if math.abs(value1 - value2) / ((value1 + value2) / 2.0) <= epsilon
true
else
false
doValuesTouch (float value1, float value2, float customEpsilon) =>
if math.abs(value1 - value2) / ((value1 + value2) / 2.0) <= customEpsilon
true
else
false
findLatestRS (timeframeInfo timeframeInfoF, string RSType, pivots, times, bannedValues) =>
RSInfo latestRSF = na
pivotsCount = pivots.size()
if pivotsCount > 0
for i = 0 to pivotsCount - 1
if i >= maxTraverse
break
index = pivotsCount - i - 1
occurances = 0
invalidValue = false
pivotValue1 = pivots.get(index)
if bannedValues.size() > 0
for a = 0 to bannedValues.size() - 1
if doValuesTouch(pivotValue1, bannedValues.get(a))
invalidValue := true
break
if invalidValue
continue
for j = 0 to pivotsCount - 1
if j >= maxTraverse
break
index2 = pivotsCount - j - 1
pivotValue2 = pivots.get(index2)
if doValuesTouch(pivotValue1, pivotValue2)
occurances += 1
if occurances >= strength
latestRSF := newRSInfo(RSType)
latestRSF.price := pivotValue1
break
if math.abs(index - index2) > maxPivotsBackSR * strength
break
if not na(latestRSF)
break
if not na(latestRSF)
cnt = 0
if pivotsCount > 0
for i = 0 to pivotsCount - 1
if i >= maxTraverse
break
index = pivotsCount - i - 1
pivotValue = pivots.get(index)
if doValuesTouch(pivotValue, latestRSF.price)
labelTime = times.get(index)
latestRSF.points.push(chart.point.from_time(labelTime, pivotValue))
cnt += 1
if cnt == strength
break
if not (debug_labelPivots == "None")
if not (debug_labelPivots == "All")
if not na(latestRSF)
cnt = 0
if pivotsCount > 0
for i = 0 to pivotsCount - 1
index = pivotsCount - i - 1
pivotValue = pivots.get(index)
if doValuesTouch(pivotValue, latestRSF.price)
labelTime = times.get(index)
latestRSF.debugPoints.push(RSType == "Resistance" ? label.new(labelTime,pivotValue,text=debug_pivotLabelText ? str.tostring(pivotValue) : "",xloc=xloc.bar_time, color=resistanceColor, textcolor=color.white) : label.new(labelTime,pivotValue,text=debug_pivotLabelText ? str.tostring(pivotValue) : "",xloc=xloc.bar_time, color=supportColor,style = label.style_label_up, textcolor=color.white))
cnt += 1
if cnt == strength
break
else
if not na(latestRSF)
if pivotsCount > 0
for i = 0 to pivotsCount - 1
index = pivotsCount - i - 1
pivotValue = pivots.get(index)
labelTime = times.get(index)
latestRSF.debugPoints.push(RSType == "Resistance" ? label.new(labelTime,pivotValue,text=debug_pivotLabelText ? str.tostring(pivotValue) : "",xloc=xloc.bar_time, color=resistanceColor, textcolor=color.white) : label.new(labelTime,pivotValue,text=debug_pivotLabelText ? str.tostring(pivotValue) : "",xloc=xloc.bar_time, color=supportColor,style = label.style_label_up, textcolor=color.white))
if latestRSF.debugPoints.size() > debug_maxPivotLabels
break
latestRSF
findLatestNthRS (timeframeInfo timeframeInfoF, string RSType, pivots, times, n) =>
float[] bannedValues = array.new<float>()
foundRS = 0
RSInfo foundLatestRS = na
while foundRS < n
foundLatestRS := findLatestRS(timeframeInfoF, RSType, pivots, times, bannedValues)
if not na(foundLatestRS)
foundRS += 1
bannedValues.push(foundLatestRS.price)
else
break
foundLatestRS
isTimeframeLower (timeframe1F, timeframe2F) =>
timeframe.in_seconds(timeframe1F) < timeframe.in_seconds(timeframe2F)
getMinTimeframe (timeframe1F, timeframe2F) =>
if isTimeframeLower(timeframe1F, timeframe2F)
timeframe1F
else
timeframe2F
getMaxTimeframe (timeframe1F, timeframe2F) =>
if isTimeframeLower(timeframe1F, timeframe2F)
timeframe2F
else
timeframe1F
getFirstBreak (RSInfo rsInfo) =>
if na(rsInfo)
[na, na]
curIndex = 0
float foundBreakLevel = na
int foundBreakTime = na
while true
if curIndex >= maxTraverse
break
isBarBreak = rsInfo.RSType == "Resistance" ? (close[curIndex + 1] <= rsInfo.price and close[curIndex] > rsInfo.price) : (close[curIndex + 1] >= rsInfo.price and close[curIndex] < rsInfo.price)
if isBarBreak
isTrueBreakout = true
if avoidFalseBreaks
shortTerm = 5
longTerm = 15
shortSum = 0.0
longSum = 0.0
for i = 0 to shortTerm
shortSum += volume[curIndex + i]
for i = 0 to longTerm
longSum += volume[curIndex + i]
shortVolumeAvg = shortSum / shortTerm
longVolumeAvg = longSum / longTerm
volumeRatio = ((shortVolumeAvg - longVolumeAvg) / longVolumeAvg) * 100.0
isTrueBreakout := (volumeRatio >= falseBreakoutVolumeThreshold)
if isTrueBreakout
foundBreakLevel := rsInfo.RSType == "Resistance" ? low[curIndex] : high[curIndex]
foundBreakTime := time[curIndex]
curIndex += 1
if time[curIndex] <= rsInfo.points.get(strength - 1).time
break
[foundBreakLevel, foundBreakTime]
getRetests (RSInfo rsInfo) =>
if na(rsInfo)
[na,na]
curIndex = 0
lastRetestIndex = -999
int[] retestTimes = array.new<int>()
float[] retestLevels = array.new<float>()
while true
if curIndex >= maxTraverse
break
if retestLevels.size() == maxRetestLabels
break
if rsInfo.isBroken and time[curIndex] >= rsInfo.brokenTime
curIndex += 1
continue
differencePercent = 100.0 * math.abs(rsInfo.price - close[curIndex]) / ((rsInfo.price + close[curIndex]) / 2)
isRetest = (rsInfo.RSType == "Resistance" ? (doValuesTouch(rsInfo.price, close[curIndex], retestEpsilon) or doValuesTouch(rsInfo.price, high[curIndex], retestEpsilon) or high[curIndex] > rsInfo.price) : (doValuesTouch(rsInfo.price, close[curIndex], retestEpsilon) or doValuesTouch(rsInfo.price, low[curIndex], retestEpsilon) or low[curIndex] < rsInfo.price)) and differencePercent < retestPriceDifferencePercentMax
if isRetest and curIndex - lastRetestIndex >= retestLabelEveryXBars
retestLevels.push(rsInfo.RSType == "Resistance" ? high[curIndex] : low[curIndex])
retestTimes.push(time[curIndex])
lastRetestIndex := curIndex
curIndex += 1
if time[curIndex] <= rsInfo.points.get(strength - 1).time
break
[retestLevels, retestTimes]
formatTimeframeString (formatTimeframe) =>
timeframeF = formatTimeframe == "" ? timeframe.period : formatTimeframe
if str.contains(timeframeF, "D") or str.contains(timeframeF, "W") or str.contains(timeframeF, "S") or str.contains(timeframeF, "M")
timeframeF
else
seconds = timeframe.in_seconds(timeframeF)
if seconds >= 3600
hourCount = int(seconds / 3600)
str.tostring(hourCount) + " Hour" + (hourCount > 1 ? "s" : "")
else
timeframeF + " Min"
getPivot (pivotType) =>
pivot = (pivotType == "high" ? ta.pivothigh(high, pivotRange, pivotRange) : ta.pivotlow(low, pivotRange, pivotRange))
pivot
handleRSInfo (timeframeInfo timeframeInfoF, RSInfo RSInfoF, int index, string RSType) =>
if not na(RSInfoF)
if not na(timeframeInfoF)
curRSList.push(RSInfoF)
[foundBreakLevel, foundBreakTime] = getFirstBreak(RSInfoF)
RSInfoF.isBroken := na(foundBreakLevel) ? false : true
RSInfoF.brokenTime := na(foundBreakLevel) ? na : foundBreakTime
if not na(foundBreakLevel)
if showBreaks
if na(RSInfoF.breakLabel)
RSInfoF.breakLabel := createBreakLabel(RSInfoF.RSType)
label.set_xy(RSInfoF.breakLabel, foundBreakTime, foundBreakLevel * (RSInfoF.RSType == "Resistance" ? (1.0 / labelOffsetsY) : labelOffsetsY))
if expandLines
if na(RSInfoF.breakLine) and enableZones == false
RSInfoF.breakLine := createRSLine(color.black)
if na(RSInfoF.breakBox) and enableZones == true
RSInfoF.breakBox := createRSBox(color.black, xloc.bar_time)
if not enableZones
line.set_extend(RSInfoF.breakLine, extend.right)
else
box.set_extend(RSInfoF.breakBox, extend.right)
if inverseBrokenLineColor and showBreaks
if not enableZones
line.set_color(RSInfoF.breakLine, RSInfoF.RSType == "Resistance" ? supportColor : resistanceColor)
else
box.set_bgcolor(RSInfoF.breakBox, RSInfoF.RSType == "Resistance" ? supportColor : resistanceColor)
else
if not enableZones
line.set_color(RSInfoF.breakLine, RSInfoF.RSType == "Resistance" ? resistanceColor : supportColor)
else
box.set_bgcolor(RSInfoF.breakBox, RSInfoF.RSType == "Resistance" ? resistanceColor : supportColor)
if showRetests
[retestLevels, retestTimes] = getRetests(RSInfoF)
if not na(retestLevels) and retestLevels.size() > 0
for i = 0 to retestLevels.size() - 1
newRetestLabel = createRetestLabel(RSInfoF.RSType)
label.set_xy(newRetestLabel, retestTimes.get(i), retestLevels.get(i) * (RSInfoF.RSType == "Support" ? (1.0 / labelOffsetsY) : labelOffsetsY))
RSInfoF.retestLabels.push(newRetestLabel)
//timeSkipOffset = maxTimeskipMS / 4
timeSkipOffset = 0
if enableZones
zoneEndX = time + timeSkipOffset + timeframe.in_seconds(timeframe.period) * 1000 * labelOffsetsXIndex
startTime = math.min(time, RSInfoF.points.get(strength - 1).time)
moveRSInfoBox(RSInfoF.box, startTime, RSInfoF.price, na(foundBreakTime) ? zoneEndX : foundBreakTime)
moveRSInfoBox(RSInfoF.breakBox, foundBreakTime, RSInfoF.price, zoneEndX)
else
endTime = time + timeSkipOffset + timeframe.in_seconds(timeframe.period) * 1000
startTime = math.min(time, RSInfoF.points.get(strength - 1).time)
moveLine(RSInfoF.line, startTime, RSInfoF.price, na(foundBreakTime) ? endTime : foundBreakTime)
moveLine(RSInfoF.breakLine, foundBreakTime, RSInfoF.price, endTime)
//log.info(str.tostring(RSInfoF.price) + " | " + str.tostring(RSInfoF.points.get(strength - 1).time) + " = " + str.tostring(line.get_x1(RSInfoF.line)) + " | " + str.tostring(endTime) + " = " + str.tostring(line.get_x2(RSInfoF.line)))
if expandLines
if not enableZones
line.set_extend(RSInfoF.line, (na(foundBreakTime)) ? extend.both : extend.left)
else
box.set_extend(RSInfoF.box, (na(foundBreakTime)) ? extend.both : extend.left)
else
if not enableZones
line.set_extend(RSInfoF.line, na(foundBreakTime) ? extend.right : extend.none)
else
box.set_extend(RSInfoF.box, na(foundBreakTime) ? extend.right : extend.none)
//labelTitleOld = formatTimeframeString(timeframeInfoF.timeframeStr) + " " + RSInfoF.RSType + " " + str.tostring(index + 1) + " (" + str.tostring(RSInfoF.price,format.mintick) + ")" + (RSInfoF.isBroken ? " [Broken]" : "")
labelTitle = formatTimeframeString(timeframeInfoF.timeframeStr) + " | " + str.tostring(RSInfoF.price,format.mintick) + ((debug_showBrokenOnLabel and RSInfoF.isBroken) ? " [B]" : "")
if not enableZones
label.set_text(RSInfoF.priceLabel, enableZones ? "" : labelTitle)
label.set_y(RSInfoF.priceLabel, RSInfoF.price)
else
box.set_text(RSInfoF.box, (RSInfoF.isBroken and expandLines) ? "" : labelTitle)
box.set_text(RSInfoF.breakBox, labelTitle)
if expandLines or not RSInfoF.isBroken
if not enableZones
label.set_xloc(RSInfoF.priceLabel, bar_index + labelOffsetsXIndex, xloc.bar_index)
else
box.set_text_halign(RSInfoF.breakBox, text.align_right)
box.set_text_halign(RSInfoF.box, text.align_right)
else
if not enableZones
label.set_xloc(RSInfoF.priceLabel, (RSInfoF.points.get(strength - 1).time + RSInfoF.brokenTime) / 2, xloc.bar_time)
else
box.set_text_halign(RSInfoF.box, text.align_center)
box.set_text_halign(RSInfoF.breakBox, text.align_center)
else
log.error("Couldn't find timeframe " + str.tostring(timeframeInfoF.index) + " " + str.tostring(index + 1) + "th " + RSType + " . Try decreasing pivot range in the settings.")
handleTimeframe (timeframeIndex, lowPivots, highPivots, lowTimes, highTimes) =>
timeframeInfoF = timeframeInfos.get(timeframeIndex - 1)
timeframeInfoF.lowPivots.clear()
timeframeInfoF.highPivots.clear()
timeframeInfoF.lowTimes.clear()
timeframeInfoF.highTimes.clear()
timeframeInfoF.lowPivots := lowPivots
timeframeInfoF.highPivots := highPivots
timeframeInfoF.lowTimes := lowTimes
timeframeInfoF.highTimes := highTimes
getHigherTFData (timeframeStr) =>
request.security(syminfo.tickerid, getMaxTimeframe(timeframe.period, timeframeStr), [allLowPivots, allHighPivots, allLowTimes, allHighTimes])
pushHighPivots (timeframeInfoF, highPivotF, timeF) =>
if not na(highPivotF)
timeframeInfoF.highPivots.push(highPivotF)
timeframeInfoF.highTimes.push(timeF)
pushLowPivots (timeframeInfoF, lowPivotF, timeF) =>
if not na(lowPivotF)
timeframeInfoF.lowPivots.push(lowPivotF)
timeframeInfoF.lowTimes.push(timeF)
handleTimeframeIfLower (timeframeInfo timeframeInfoF, highs, lows, int[] timesF) =>
if timeframeInfoF.isEnabled and isTimeframeLower(timeframeInfoF.timeframeStr, timeframe.period)
if highs.size() > 0
for i = 0 to highs.size() - 1
timeF = timesF.get(i)
pushHighPivots(timeframeInfoF, highs.get(i), timeF)
if lows.size() > 0
for i = 0 to lows.size() - 1
timeF = timesF.get(i)
pushLowPivots(timeframeInfoF, lows.get(i), timeF)
getLowerTFData (timeframeStr) =>
lowPivots = isTimeframeLower(timeframeStr, timeframe.period) ? request.security_lower_tf(syminfo.tickerid, getMinTimeframe(timeframeStr, timeframe.period), ta.pivotlow(low, pivotRange, pivotRange)) : na
highPivots = isTimeframeLower(timeframeStr, timeframe.period) ? request.security_lower_tf(syminfo.tickerid, getMinTimeframe(timeframeStr, timeframe.period), ta.pivothigh(high, pivotRange, pivotRange)) : na
times = isTimeframeLower(timeframeStr, timeframe.period) ? request.security_lower_tf(syminfo.tickerid, getMinTimeframe(timeframeStr, timeframe.period), time[pivotRange]) : na
[lowPivots,highPivots,times,times]
getTFData (timeframeStr) =>
if isTimeframeLower(timeframeStr, timeframe.period)
getLowerTFData(timeframeStr)
else
getHigherTFData(timeframeStr)
checkIfRSAreSame (RSInfo rsInfo1, RSInfo rsInfo2) =>
if na(rsInfo1) or na(rsInfo2)
false
else if rsInfo1.RSType != rsInfo2.RSType
false
else if rsInfo1.price != rsInfo2.price
false
else
true
checkIfArrHasRS (RSInfo[] arr, RSInfo rsInfoF) =>
if na(arr) or na(rsInfoF)
true
else if arr.size() == 0
false
else
foundRS = false
for i = 0 to arr.size() - 1
arrRS = arr.get(i)
if checkIfRSAreSame(arrRS, rsInfoF)
foundRS := true
break
if foundRS
true
else
false
clearTimeframeRS (timeframeInfoF) =>
oldRetestsCount = 0
oldBreaksCount = 0
if timeframeInfoF.resistances.size() > 0
for j = 0 to timeframeInfoF.resistances.size() - 1
RSInfo RSInfoF = timeframeInfoF.resistances.get(j)
if not na(RSInfoF)
if debug_enabledHistory
if checkIfArrHasRS(oldRSList, RSInfoF) == false
oldRSList.push(RSInfoF)
oldRetestsCount += RSInfoF.retestLabels.size()
oldBreaksCount += RSInfoF.isBroken ? 1 : 0
if timeframeInfoF.supports.size() > 0
for j = 0 to timeframeInfoF.supports.size() - 1
RSInfo RSInfoF = timeframeInfoF.supports.get(j)
if not na(RSInfoF)
if debug_enabledHistory
if checkIfArrHasRS(history, RSInfoF) == false
oldRSList.push(RSInfoF)
oldRetestsCount += RSInfoF.retestLabels.size()
oldBreaksCount += RSInfoF.isBroken ? 1 : 0
timeframeInfoF.resistances.clear()
timeframeInfoF.supports.clear()
[oldRetestsCount, oldBreaksCount]
findTimeframeRS (timeframeInfoF, RSType, arr, count, pivots, times) =>
curRetestsCount = 0
curBreaksCount = 0
if count > 0
for j = 0 to count - 1
foundRS = findLatestNthRS(timeframeInfoF, RSType, pivots, times, j + 1)
if not na(foundRS)
notDuplicate = true
for a = 0 to timeframeInfos.size() - 1
aInfo = timeframeInfos.get(a)
if na(aInfo) or aInfo.isEnabled == false
continue
otherTimeframeArray = (RSType == "Resistance" ? aInfo.resistances : aInfo.supports)
if otherTimeframeArray.size() > 0
for b = 0 to otherTimeframeArray.size() - 1
if checkIfRSAreSame(foundRS, otherTimeframeArray.get(b))
notDuplicate := false
break
if notDuplicate == false
break
if notDuplicate or not debug_removeDuplicateRS
arr.push(foundRS)
if arr.size() > 0
for j = 0 to arr.size() - 1
curRS = arr.get(j)
if not na(curRS)
handleRSInfo(timeframeInfoF, curRS, j, RSType)
curRetestsCount += curRS.retestLabels.size()
curBreaksCount += curRS.isBroken ? 1 : 0
[curRetestsCount, curBreaksCount]
lowPivot = getPivot("low")
highPivot = getPivot("high")
if not na(lowPivot)
allLowPivots.push(lowPivot)
allLowTimes.push(time[pivotRange])
if allLowPivots.size() > maxPivotsAllowed
allLowPivots.remove(0)
allLowTimes.remove(0)
if not na(highPivot)
allHighPivots.push(highPivot)
allHighTimes.push(time[pivotRange])
if allHighPivots.size() > maxPivotsAllowed
allHighPivots.remove(0)
allHighTimes.remove(0)
if calculateTimeSkipMS
if last_bar_index - bar_index < 350 and time - time[1] > timeframe.in_seconds(timeframe.period) * 1000
maxTimeskipMS := math.max(maxTimeskipMS, time - time[1])
[lowPivotsTF1, highPivotsTF1, lowTimesTF1, highTimesTF1] = getTFData(timeframe1)
handleTimeframeIfLower(timeframeInfos.get(0), highPivotsTF1, lowPivotsTF1, highTimesTF1)
[lowPivotsTF2, highPivotsTF2, lowTimesTF2, highTimesTF2] = getTFData(timeframe2)
handleTimeframeIfLower(timeframeInfos.get(1), highPivotsTF2, lowPivotsTF2, highTimesTF2)
[lowPivotsTF3, highPivotsTF3, lowTimesTF3, highTimesTF3] = getTFData(timeframe3)
handleTimeframeIfLower(timeframeInfos.get(2), highPivotsTF3, lowPivotsTF3, highTimesTF3)
//plot(nz(na,timeframeInfos.get(0).highPivots.size() > 0 ? timeframeInfos.get(0).highPivots.get(timeframeInfos.get(0).highPivots.size() - 1) : 0), color = color.blue, title = "High Pivots")
//plot(nz(na,timeframeInfos.get(0).lowPivots.size() > 0 ? timeframeInfos.get(0).lowPivots.get(timeframeInfos.get(0).lowPivots.size() - 1) : 0), color = color.fuchsia, title = "Low Pivots")
if barstate.islast
if timeframe1Enabled and not isTimeframeLower(timeframe1, timeframe.period)
handleTimeframe(1, lowPivotsTF1, highPivotsTF1, lowTimesTF1, highTimesTF1)
if timeframe2Enabled and not isTimeframeLower(timeframe2, timeframe.period)
handleTimeframe(2, lowPivotsTF2, highPivotsTF2, lowTimesTF2, highTimesTF2)
if timeframe3Enabled and not isTimeframeLower(timeframe3, timeframe.period)
handleTimeframe(3, lowPivotsTF3, highPivotsTF3, lowTimesTF3, highTimesTF3)
int enabledTimeframeCount = 0
for i = 0 to timeframeCount - 1
timeframeInfo curInfo = timeframeInfos.get(i)
if curInfo.isEnabled
enabledTimeframeCount += 1
int oldRetestsCount = 0
int curRetestsCount = 0
int oldBreaksCount = 0
int curBreaksCount = 0
for i = 0 to timeframeCount - 1
timeframeInfo curInfo = timeframeInfos.get(i)
if not curInfo.isEnabled
continue
[oldRetests, oldBreaks] = clearTimeframeRS(curInfo)
oldRetestsCount += oldRetests
oldBreaksCount += oldBreaks
resistanceCount = math.min(DEBUG ? debug_lastXResistances : resistanceSupportCount, maxResistances - (enabledTimeframeCount > 1 ? 1 : 0))
resistanceCount := math.max(resistanceCount, 0)
supportCount = math.min(DEBUG ? debug_lastXSupports : resistanceSupportCount, maxSupports - (enabledTimeframeCount > 1 ? 1 : 0))
supportCount := math.max(supportCount, 0)
[curRetests1, curBreaks1] = findTimeframeRS(curInfo, "Resistance", curInfo.resistances, resistanceCount, curInfo.highPivots, curInfo.highTimes)
[curRetests2, curBreaks2] = findTimeframeRS(curInfo, "Support", curInfo.supports, supportCount, curInfo.lowPivots, curInfo.lowTimes)
curRetestsCount += curRetests1 + curRetests2
curBreaksCount += curBreaks1 + curBreaks2
if debug_enabledHistory
historyIndexesToDelete = array.new<int>(0)
if history.size() > 0
for i = 0 to history.size() - 1
if checkIfArrHasRS(curRSList, history.get(i))
historyIndexesToDelete.push(i)
if historyIndexesToDelete.size() > 0
for i = 0 to historyIndexesToDelete.size() - 1
deleteIndex = historyIndexesToDelete.get(historyIndexesToDelete.size() - i - 1)
safeDeleteRSInfo(history.get(deleteIndex))
history.remove(deleteIndex)
if oldRSList.size() > 0
for i = 0 to oldRSList.size() - 1
curRS = oldRSList.get(i)
if checkIfArrHasRS(curRSList, curRS) == false
history.push(histRSInfo(curRS))
if history.size() > debug_maxHistoryRecords
safeDeleteRSInfo(history.get(0))
history.remove(0)
if oldRSList.size() > 0
for i = 0 to oldRSList.size() - 1
safeDeleteRSInfo(oldRSList.get(i))
curRSList.clear()
oldRSList.clear()
if DEBUG
log.info("History Size : " + str.tostring(history.size()))
log.info("Label Count : " + str.tostring(label.all.size()))
log.info("Line Count : " + str.tostring(line.all.size()))
log.info("Box Count : " + str.tostring(box.all.size()))
if enableRetestAlerts and curRetestsCount > oldRetestsCount and initRun == false
alert("New Retests Occured.")
if enableBreakAlerts and curBreaksCount > oldBreaksCount and initRun == false
alert("New Breaks Occured.")
initRun := false
Laporan COT CFTC mingguan
COT CFTC Analysis Tool
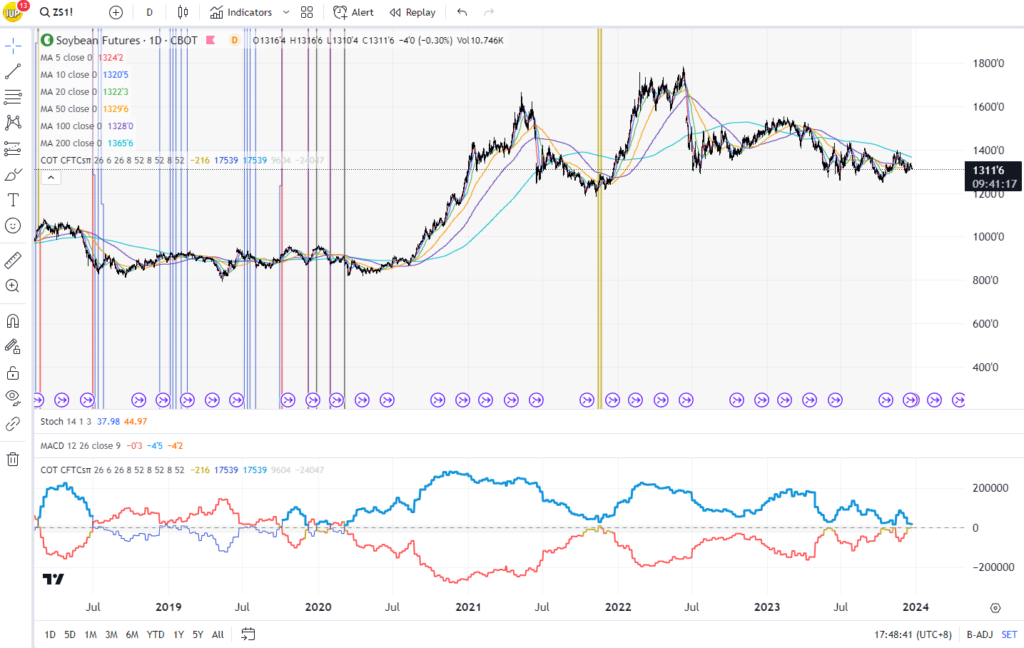
Kod program:
Pine Script
Pengenalan:
Alat ini digunakan untuk menganalisis secara terperinci data Komitmen Pedagang (COT) daripada Suruhanjaya Hadapan Komoditi A.S. (CFTC). Bantu peniaga dan pelabur memperoleh pemahaman yang lebih mendalam tentang pasaran, memanfaatkan kedudukan spekulator besar, institusi komersial dan kedudukan bukan pelaporan untuk mendapatkan gambaran keseluruhan pasaran yang komprehensif.
Produk yang sah:
// This source code is subject to the terms of the Mozilla Public License 2.0 at https://mozilla.org/MPL/2.0/
// @1uptick

//@version=5
indicator('COT CFTC All', shorttitle='COT CFTCsπ', precision=0, overlay = false)
import PineCoders/Time/3

col_up =color.rgb(166, 220, 168)
col_down = color.rgb(195, 114, 114)
col_neutral = color.gray
colorup_strong = input(#a6dca8ce)
colorup_week = input(#a6dca884)
colordown_strong = input(#b66a6a)
colordown_week = input(#95555582)

hline(50)
hline(75, title = "Buying High Line", color = color.rgb(166, 220, 168), linewidth = 2, linestyle = hline.style_dashed, display = display.none)
hline(25, title = "Selling Low Line", color = color.rgb(195, 114, 114), linewidth = 2, linestyle = hline.style_dashed, display = display.none)
h65 = hline(70, color = color.rgb(255, 255, 255, 100), display = display.none)
h100 = hline(100, color = color.rgb(255, 255, 255, 100), display = display.none)
fill(h65, h100, color=color.rgb(108, 255, 82, 95))
h35 = hline(30, color = color.rgb(255, 255, 255, 100), display = display.none)
h0 = hline(0, color = color.rgb(255, 255, 255, 100), display = display.none)
fill(h35, h0, color=color.rgb(255, 82, 82, 95))

Index_Length = input(26)
Index_Length1 = input(6)
custom_index(src, Index_Length) =>
    max = ta.highest(src, Index_Length)
    min = ta.lowest(src, Index_Length)
    willco_index = 100 * (src - min) / (max - min)
    willco_index


do_oi_rescale = input.bool(true, title="Rescale Open Interest")


qticker = syminfo.root == "ZB" ? "020601" : syminfo.root == 'DX' ? '098662' : syminfo.root == "ZN" ? "043602" : syminfo.root == "ZS" ? "005602" : syminfo.root == "ZM" ? "026603" : syminfo.root == "ZL" ? "007601" : syminfo.root == "ZC" ? "002602" : syminfo.root == "ZW" ? "001602" : syminfo.root == "KE" ? "001612" : syminfo.root == "HE" ? "054642" : syminfo.root == "LE" ? "057642" : syminfo.root == "GC" ? "088691" : syminfo.root == "SI" ? "084691" : syminfo.root == "HG" ? "085692" : syminfo.root == "CL" ? "067651" : syminfo.root == "HO" ? "022651" : syminfo.root == "RB" ? "111659" : syminfo.root == "NG" ? "023651" : syminfo.root == "6A" ? "232741" : syminfo.root == "6B" ? "096742" : syminfo.root == "6C" ? "090741" : syminfo.root == "6E" ? "099741" : syminfo.root == "6J" ? "097741" : syminfo.root == "6S" ? "092741" : syminfo.root == "SB" ? "080732" : syminfo.root == "KC" ? "083731" : syminfo.root == "CC" ? "073732" : syminfo.root == "CT" ? "033661" : syminfo.root == "ES" ? "13874A" : syminfo.root == "RTY" ? "239742" : syminfo.root == "YM" ? "12460P" : syminfo.root == "NQ" ? "209742" : syminfo.root == "PA" ? "075651" : syminfo.root == "PL" ? "076651" : syminfo.root == "AUP" ? "191693" : syminfo.root == "AUP" ? "191693" : syminfo.root == "HRC" ? "192651" : syminfo.root == "EH" ? "025651" : syminfo.root == "BB" ? "06765T" : syminfo.root == "ZR" ? "039601" : syminfo.root == "ZO" ? "004603" : syminfo.root == "DC" ? "052641" : syminfo.root == "OJ" ? "040701" : syminfo.root == "LBS" ? "058643" : syminfo.root == "GF" ? "061641" : syminfo.root == "SP" ? "138741" : syminfo.root == "DJIA" ? "12460P" : syminfo.root == "6N" ? "112741" : syminfo.root == "6L" ? "102741" : syminfo.root == "VX" ? "1170E1" : syminfo.root == "6M" ? "095741" : syminfo.root == "6R" ? "089741" : syminfo.root == "6Z" ? "122741" : syminfo.root == "ZT" ? "042601" : syminfo.root == "ZF" ? "044601" : syminfo.root == 'BTC' ? '133741' : syminfo.root == 'ETH' ? '146022' : ""


legacy_cot = 'QUANDL:CFTC/' + qticker + ('_F_L_ALL_OI|') //percent of Open Interest Futures Only
legacy_cot1 = 'QUANDL:CFTC/' + qticker + ('_F_L_ALL|') //Futures Only legacy report
legacy_cot2 = 'QUANDL:CFTC/' + qticker + ('_FO_L_ALL|') // Futures with Options


non_commercials_long = request.security(legacy_cot + '1', 'W', close)
non_commercials_short = request.security(legacy_cot + '2', 'W', close)
non_commercials_spread = request.security(legacy_cot + '3', 'W', close)
non_commercials_net = non_commercials_long - non_commercials_short
non_commercials_spread_index = custom_index(non_commercials_spread, Index_Length)

commercials_long = request.security(legacy_cot + '4', 'W', close)
commercials_short = request.security(legacy_cot + '5', 'W', close)
commercials_net = commercials_long - commercials_short

more_oi_index = non_commercials_net < commercials_net ? commercials_net : non_commercials_net
more_oi_index_col = non_commercials_net < commercials_net ? color.rgb(255, 82, 82, 85) : non_commercials_net > commercials_net ? color.rgb(33, 149, 243, 85) : na


non_reportable_long = request.security(legacy_cot + '8', 'W', close)
non_reportable_short = request.security(legacy_cot + '9', 'W', close)
non_reportable_net = non_reportable_long - non_reportable_short


//----------

lspecs_long = request.security(legacy_cot1 + '1', 'W', close)
lspecs_short = request.security(legacy_cot1 + '2', 'W', close)
lspecs_net = lspecs_long - lspecs_short

comm_long = request.security(legacy_cot1 + '4', 'W', close)
comm_short = request.security(legacy_cot1 + '5', 'W', close)
comm_net = comm_long - comm_short

more_oi_commercials = non_commercials_net < commercials_net ? comm_net : na
more_oi_largespecs = non_commercials_net > commercials_net ? lspecs_net : na

sspecs_long = request.security(legacy_cot1 + '8', 'W', close)
sspecs_short = request.security(legacy_cot1 + '9', 'W', close)
sspecs_net = sspecs_long - sspecs_short

//----------

lspecs_long2 = request.security(legacy_cot2 + '1', 'W', close)
lspecs_short2 = request.security(legacy_cot2 + '2', 'W', close)
lspecs_net2 = (lspecs_long2 - lspecs_long) - (lspecs_short2 - lspecs_short)
plot(lspecs_net2, title="Large Specs Options", color=color.blue, linewidth = 1, style=plot.style_line, display = display.none)

comm_long2 = request.security(legacy_cot2 + '4', 'W', close)
comm_short2 = request.security(legacy_cot2 + '5', 'W', close)
comm_net2 = (comm_long2 - comm_long) - (comm_short2 - comm_short)
plot(comm_net2, title="Commercials Options", color=color.red, linewidth = 1, style=plot.style_line, display = display.none)

sspecs_long2 = request.security(legacy_cot2 + '8', 'W', close)
sspecs_short2 = request.security(legacy_cot2 + '9', 'W', close)
sspecs_net2 = (sspecs_long2 - sspecs_long) - (sspecs_short2 - sspecs_short)
plot(sspecs_net2, title="Small Specs Options", color=color.green, linewidth = 1, style=plot.style_line, display = display.none)

//----------

oi = request.security(legacy_cot1 + '0', 'W', close)

normalized(xs, min_of, max_of, interval) =>
    maxi = ta.highest(max_of, interval)
    mini = ta.lowest(min_of, interval)
    (xs - mini) / (maxi - mini)

extreme(aas, bbs, interval) =>
    a1h = ta.highest(aas, interval)
    a1l = ta.lowest(aas, interval)
    b1h = ta.highest(bbs, interval)
    b1l = ta.lowest(bbs, interval)
    [math.max(a1h, b1h), math.min(a1l, b1l)]

if do_oi_rescale
    noi = normalized(oi, oi, oi, 260)
    [sub_chart_max, sub_chart_min] = extreme(comm_net, lspecs_net, 260)
    rescaled_oi = noi * (sub_chart_max - sub_chart_min) + sub_chart_min
    oi := rescaled_oi

oi_momentum = input(26)

oi_minus_large = lspecs_net - oi
oi_plus_comm = comm_net + oi
oi_minus_large_mom = (oi_minus_large - oi_minus_large[oi_momentum ])
oi_plus_comm_mom = (oi_plus_comm - oi_plus_comm[oi_momentum ])

plot(oi_minus_large_mom, title="LargeSpecs - OI", color=color.rgb(53, 77, 58, 80), style=plot.style_area, linewidth = 2, display = display.none)
plot(oi_plus_comm_mom, title="Commercials + OI", color=color.rgb(67, 48, 48, 80), style=plot.style_area, linewidth = 2, display = display.none)

//----------------5% Detector for COT NET--------------------

max = ta.max(comm_net)
min = ta.min(comm_net)
percentbull = (max / 100 * 5)
percentbear = (min / 100 * 5)

maxmincol = comm_net == max or comm_net == min or comm_net <= percentbull and comm_net >= percentbear ? color.rgb(197, 170, 20) : color.red


// Plotting the data with different colors
plot(commercials_net, color=color.rgb(156, 17, 17), title="Commercials Net %OI", linewidth = 3, display = display.none)
plot(ta.sma(commercials_net, input(8)), color=color.rgb(7, 5, 147), title="Commercials Net SMA %OI", display = display.none)
plot(ta.sma(commercials_net, input(52)), color=color.rgb(12, 64, 162), title="Commercials Net SMA %OI", display = display.none)
plot(commercials_long, color=color.blue, title="Commercials Long %OI", display = display.none)
plot(ta.sma(commercials_long, input(8)), color=color.rgb(7, 5, 147), title="Commercials Long SMA %OI", display = display.none)
plot(ta.sma(commercials_long, input(52)), color=color.rgb(12, 64, 162), title="Commercials Long SMA %OI", display = display.none)
plot(commercials_short, color=color.rgb(219, 80, 25), title="Commercials Short %OI", display = display.none)
plot(ta.sma(commercials_short, input(8)), color=color.rgb(7, 5, 147), title="Commercials Short SMA %OI", display = display.none)
plot(ta.sma(commercials_short, input(52)), color=color.rgb(12, 64, 162), title="Commercials Short SMA %OI", display = display.none)

plot(custom_index(commercials_long, Index_Length), color=color.blue, title="Willco Commercials Long %OI 26", display = display.none)
plot(custom_index(-commercials_short, Index_Length), color=color.rgb(219, 80, 25), title="Willco Commercials Short %OI 26", display = display.none)
comnet_comnetpct = input(false, title='Commercials Net or Commercials Percent of OI', tooltip = 'Choose, if you want to use Commercials Net Positions instead of Commercials Net of Open Interest')
comNetIndex = comnet_comnetpct ? custom_index(comm_net, Index_Length) : custom_index(commercials_net, Index_Length)
comNetIndex2 = comnet_comnetpct ? custom_index(comm_net, Index_Length1) : custom_index(commercials_net, Index_Length1)
plot(comNetIndex, color=maxmincol, linewidth = 3 , title="Willco Commercials Net %OI 26", display = display.none)
plot(comNetIndex2, color=color.rgb(154, 22, 22), title="Willco Commercials Net %OI 6", display = display.none)

plot(non_commercials_net, color=color.green, title="Non-Commercials Net %OI", display = display.none)
plot(non_commercials_long, color=color.blue, title="Non-Commercials Long %OI", display = display.none)
plot(non_commercials_short, color=color.red, title="Non-Commercials Short %OI", display = display.none)
plot(non_commercials_spread, color=color.yellow, title="Non-Commercials Spread %OI", display = display.none)
plot(non_commercials_spread_index, color=color.yellow, title="Non-Commercials Spread Index", display = display.none)

plot(custom_index(more_oi_index, Index_Length), color=more_oi_index_col, linewidth = 2, title="Willco who has more %OI 26", style = plot.style_area, display = display.none)

plot(non_reportable_net, color=color.purple, title="Non-Reportable Net %OI", display = display.none)
plot(non_reportable_long, color=color.blue, title="Non-Reportable Long %OI", display = display.none)
plot(non_reportable_short, color=color.red, title="Non-Reportable Short %OI", display = display.none)

plot(custom_index(non_reportable_net, Index_Length), color=color.green, linewidth = 1, title="Willco Non Reportable %OI 26", style = plot.style_line, display = display.none)

//-----------

plot(oi, color=color.gray, title="Open Interest", display = display.none)
plot(comm_long, title = "Commercials long",           color = colorup_week, style = plot.style_columns, display = display.none)
plot(-comm_short, title = "Commercials short",         color = colordown_week, style = plot.style_columns, display = display.none)
plot(comm_net, title = "Commercials net with color yellow if extrem minmax or 5% extrem Value",        color = maxmincol, linewidth =2)
plot(more_oi_commercials, title = "Commercials net if more OI",        color = color.rgb(200, 64, 64), linewidth = 3, style = plot.style_linebr, display = display.none)
plot(lspecs_long, title = "Large Speculators long",   color = colorup_week, style = plot.style_columns, display = display.none)
plot(-lspecs_short, title = "Large Speculators short", color = colordown_week, style = plot.style_columns, display = display.none)
plot(lspecs_net, title = "Large Speculators net",color = color.rgb(29, 65, 211))
plot(more_oi_largespecs, title = "Large Speculators net if more OI",color = color.rgb(14, 148, 220), linewidth = 3, style = plot.style_linebr)
plot(sspecs_long, title = "Small Speculators long",   color = colorup_week, style = plot.style_columns, display = display.none)
plot(-sspecs_short, title = "Small Speculators short", color = colordown_week, style = plot.style_columns, display = display.none)
plot(sspecs_net, title = "Small Speculators net",     color = color.rgb(35, 128, 34), display = display.none)


//-----------

hline(0, color=color.rgb(160, 165, 179, 70), linestyle=hline.style_dotted, linewidth=1)


//----------------5% Detector for COT NET--------------------


p1 = plot(percentbull, title="+5%", color=color.rgb(208, 215, 208, 80), linewidth = 1, style= plot.style_area)
p2 = plot(percentbear, title="-5%", color=color.rgb(208, 215, 208, 80), linewidth = 1, style= plot.style_area)
Pengesanan Gelombang Elliott
Elliott Wave Detector
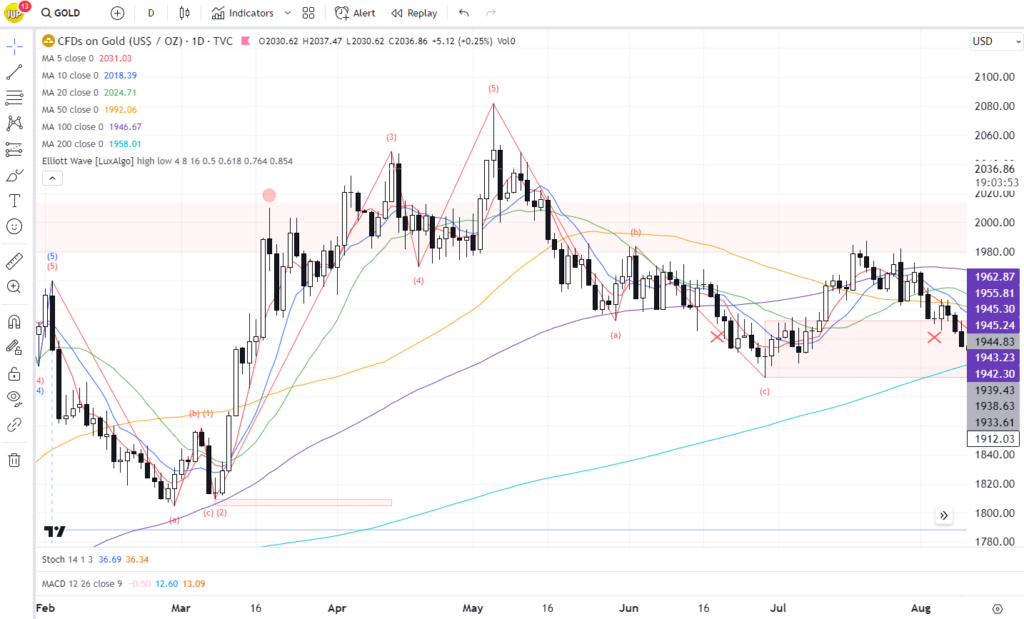
Kod program:
Pine Script
Pengenalan:
membolehkan pengguna mengesan secara automatik jalur memajukan dan membetulkan Elliott Wave pada carta. Jalur ini dikesan dan dipaparkan secara berterusan, membolehkan pengguna menjejaki evolusi jalur memajukan atau membetulkan. pengesanJalur maju yang dikesan juga boleh digunakan untuk meramalkan anjakan Fibonacci.Fibonacci retracements).Program ini juga membenarkan pengguna menetapkan "Alerts" di bawah pelbagai syarat pencetus.
// This work is licensed under a Attribution-NonCommercial-ShareAlike 4.0 International (CC BY-NC-SA 4.0) https://creativecommons.org/licenses/by-nc-sa/4.0/
//@version=5
indicator("1up Wave Detector", max_lines_count=500, max_labels_count=500, overlay=true, max_bars_back=5000)
//------------------------------------------------------------------------------
//Settings
//-----------------------------------------------------------------------------{
i_hi = input.string('high' , title= '' , group='source [high - low]', inline='hl', options=['high', 'close', 'max open/close'])
i_lo = input.string('low' , title= '' , group='source [high - low]', inline='hl', options=['low' , 'close', 'min open/close'])
s1 = input.bool (true , title= '' , group='ZigZag' , inline= '1' )
len1 = input.int ( 4 , title= ' 1 Length', group='ZigZag' , inline= '1', minval =1 )
col1 = input.color (color.red , title= '' , group='ZigZag' , inline= '1' )
s2 = input.bool (true , title= '' , group='ZigZag' , inline= '2' )
len2 = input.int ( 8 , title= ' 2 Length', group='ZigZag' , inline= '2', minval =1 )
col2 = input.color (color.blue , title= '' , group='ZigZag' , inline= '2' )
s3 = input.bool (true , title= '' , group='ZigZag' , inline= '3' )
len3 = input.int (16 , title= ' 3 Length', group='ZigZag' , inline= '3', minval =1 )
col3 = input.color (color.white , title= '' , group='ZigZag' , inline= '3' )
i_500 = input.float (0.500 , title=' level 1', group='Fibonacci values' , minval =0, maxval =1, step =0.01 )
i_618 = input.float (0.618 , title=' level 2', group='Fibonacci values' , minval =0, maxval =1, step =0.01 )
i_764 = input.float (0.764 , title=' level 3', group='Fibonacci values' , minval =0, maxval =1, step =0.01 )
i_854 = input.float (0.854 , title=' level 4', group='Fibonacci values' , minval =0, maxval =1, step =0.01 )
shZZ = input.bool (false , title= '' , group='show ZZ' , inline='zz' )
//-----------------------------------------------------------------------------}
//User Defined Types
//-----------------------------------------------------------------------------{
type ZZ
int [] d
int [] x
float[] y
line [] l
type Ewave
line l1
line l2
line l3
line l4
line l5
label b1
label b2
label b3
label b4
label b5
//
bool on
bool br //= na
//
int dir
//
line lA
line lB
line lC
label bA
label bB
label bC
//
bool next = false
//
label lb
box bx
type fibL
line wave1_0_500
line wave1_0_618
line wave1_0_764
line wave1_0_854
line wave1_pole_
linefill l_fill_
bool _break_ //= na
//-----------------------------------------------------------------------------}
//Functions
//-----------------------------------------------------------------------------{
hi = i_hi == 'high' ? high : i_hi == 'close' ? close : math.max(open, close)
lo = i_lo == 'low' ? low : i_hi == 'close' ? close : math.min(open, close)
in_out(aZZ, d, x1, y1, x2, y2, col) =>
aZZ.d.unshift(d), aZZ.x.unshift(x2), aZZ.y.unshift(y2), aZZ.d.pop(), aZZ.x.pop(), aZZ.y.pop()
if shZZ
aZZ.l.unshift(line.new(x1, y1, x2, y2, color= col)), aZZ.l.pop().delete()
method isSame(Ewave gEW, _1x, _2x, _3x, _4x) =>
t1 = _1x == gEW.l1.get_x1()
t2 = _2x == gEW.l2.get_x1()
t3 = _3x == gEW.l3.get_x1()
t4 = _4x == gEW.l4.get_x1()
t1 and t2 and t3 and t4
method isSame2(Ewave gEW, _1x, _2x, _3x) =>
t1 = _1x == gEW.l3.get_x2()
t2 = _2x == gEW.l4.get_x2()
t3 = _3x == gEW.l5.get_x2()
t1 and t2 and t3
method dot(Ewave gEW) =>
gEW.l1.set_style(line.style_dotted)
gEW.l2.set_style(line.style_dotted)
gEW.l3.set_style(line.style_dotted)
gEW.l4.set_style(line.style_dotted)
gEW.l5.set_style(line.style_dotted)
gEW.b1.set_textcolor (color(na))
gEW.b2.set_textcolor (color(na))
gEW.b3.set_textcolor (color(na))
gEW.b4.set_textcolor (color(na))
gEW.b5.set_textcolor (color(na))
gEW.on := false
method dash(Ewave gEW) =>
gEW.lA.set_style(line.style_dashed)
gEW.lB.set_style(line.style_dashed)
gEW.lC.set_style(line.style_dashed)
gEW.bA.set_textcolor (color(na))
gEW.bB.set_textcolor (color(na))
gEW.bC.set_textcolor (color(na))
gEW.bx.set_bgcolor (color(na))
gEW.bx.set_border_color (color(na))
method sol_dot(fibL nFibL, sol_dot, col) =>
style =
sol_dot == 'dot' ?
line.style_dotted :
sol_dot == 'sol' ?
line.style_solid :
line.style_dashed
nFibL.wave1_0_500.set_style(style)
nFibL.wave1_0_618.set_style(style)
nFibL.wave1_0_764.set_style(style)
nFibL.wave1_0_854.set_style(style)
nFibL.l_fill_.set_color(col)
method set(fibL nFibL, int x1, int x2, float max_500, float max_618, float max_764, float max_854, float y2) =>
nFibL.wave1_0_500.set_xy1(x1, max_500)
nFibL.wave1_0_500.set_xy2(x2, max_500)
nFibL.wave1_0_618.set_xy1(x1, max_618)
nFibL.wave1_0_618.set_xy2(x2, max_618)
nFibL.wave1_0_764.set_xy1(x1, max_764)
nFibL.wave1_0_764.set_xy2(x2, max_764)
nFibL.wave1_0_854.set_xy1(x1, max_854)
nFibL.wave1_0_854.set_xy2(x2, max_854)
nFibL.wave1_pole_.set_xy1(x1, y2 )
nFibL.wave1_pole_.set_xy2(x1, max_854)
nFibL.l_fill_.get_line1().set_xy1(x1, max_764)
nFibL.l_fill_.get_line1().set_xy2(x2, max_764)
nFibL.l_fill_.get_line2().set_xy1(x1, max_854)
nFibL.l_fill_.get_line2().set_xy2(x2, max_854)
method setNa(fibL nFibL) =>
nFibL.wave1_0_500.set_xy1(na, na)
nFibL.wave1_0_500.set_xy2(na, na)
nFibL.wave1_0_618.set_xy1(na, na)
nFibL.wave1_0_618.set_xy2(na, na)
nFibL.wave1_0_764.set_xy1(na, na)
nFibL.wave1_0_764.set_xy2(na, na)
nFibL.wave1_0_854.set_xy1(na, na)
nFibL.wave1_0_854.set_xy2(na, na)
nFibL.wave1_pole_.set_xy1(na, na)
nFibL.wave1_pole_.set_xy2(na, na)
nFibL.l_fill_.set_color(color(na))
draw(enabled, left, col, n) =>
//
max_bars_back(time, 2000)
var int dir = na, var int x1= na, var float y1 = na, var int x2 = na, var float y2 = na, var Ewave gEW = na
var int last_0x = na , var float last_0y = na , var int last_6x = na , var float last_6y = na
//
if enabled
var fibL nFibL = fibL.new(
wave1_0_500 = line.new(na, na, na, na, color= color.new(col, 50), style= line.style_solid ),
wave1_0_618 = line.new(na, na, na, na, color= color.new(col, 38), style= line.style_solid ),
wave1_0_764 = line.new(na, na, na, na, color= color.new(col, 24), style= line.style_solid ),
wave1_0_854 = line.new(na, na, na, na, color= color.new(col, 15), style= line.style_solid ),
wave1_pole_ = line.new(na, na, na, na, color= color.new(col, 50), style= line.style_dashed),
l_fill_ = linefill.new(
line.new(na, na, na, na, color= color(na))
, line.new(na, na, na, na, color= color(na))
, color= color(na))
, _break_ = na
)
//
var ZZ aZZ = ZZ.new(array.new < int > ()
, array.new < int > ()
, array.new < float > ()
, array.new < line > () )
var Ewave[] aEW = array.new < Ewave > ()
//
if barstate.isfirst
aEW.unshift(Ewave.new())
for i = 0 to 10
aZZ.d.unshift(0)
aZZ.x.unshift(0)
aZZ.y.unshift(0)
aZZ.l.unshift(shZZ ? line.new(na, na, na, na) : na)
//
sz = aZZ.d.size( )
x2 := bar_index -1
ph = ta.pivothigh(hi, left, 1)
pl = ta.pivotlow (lo, left, 1)
t = n == 2 ? '\n\n' : n == 1 ? '\n' : ''
//
// when a new Pivot High is found
if not na(ph)
gEW := aEW.get (0)
dir := aZZ.d.get (0)
x1 := aZZ.x.get (0)
y1 := aZZ.y.get (0)
y2 := nz(hi[1])
//
if dir < 1 // if previous point was a pl, add, and change direction ( 1)
in_out(aZZ, 1, x1, y1, x2, y2, col)
else
if dir == 1 and ph > y1
aZZ.x.set(0, x2), aZZ.y.set(0, y2)
if shZZ
aZZ.l.get(0).set_xy2(x2, y2)
//
_6x = x2, _6y = y2
_5x = aZZ.x.get(1), _5y = aZZ.y.get(1)
_4x = aZZ.x.get(2), _4y = aZZ.y.get(2)
_3x = aZZ.x.get(3), _3y = aZZ.y.get(3)
_2x = aZZ.x.get(4), _2y = aZZ.y.get(4)
_1x = aZZ.x.get(5), _1y = aZZ.y.get(5)
//
// –––––––––––––––––––––[ 12345 ]–––––––––––––––––––––
_W5 = _6y - _5y
_W3 = _4y - _3y
_W1 = _2y - _1y
min = math.min(_W1, _W3, _W5)
isWave =
_W3 != min and
_6y > _4y and
_3y > _1y and
_5y > _2y
//
same = gEW.isSame(_1x, _2x, _3x, _4x)
if isWave
if same
gEW.l5.set_xy2(_6x, _6y)
gEW.b5.set_xy (_6x, _6y)
else
tx = ''
if _2x == aEW.get(0).b5.get_x()
tx := '(5) (1)'
aEW.get(0).b5.set_text('')
else
tx := '(1)'
//
wave = Ewave.new(
l1 = line.new (_1x, _1y, _2x, _2y , color=col , style= line.style_solid ),
l2 = line.new (_2x, _2y, _3x, _3y , color=col , style= line.style_solid ),
l3 = line.new (_3x, _3y, _4x, _4y , color=col , style= line.style_solid ),
l4 = line.new (_4x, _4y, _5x, _5y , color=col , style= line.style_solid ),
l5 = line.new (_5x, _5y, _6x, _6y , color=col , style= line.style_solid ),
b1 = label.new(_2x, _2y, text= tx + t, textcolor=col, color= color(na), style=label.style_label_down),
b2 = label.new(_3x, _3y, text= t + '(2)', textcolor=col, color= color(na), style=label.style_label_up ),
b3 = label.new(_4x, _4y, text= '(3)' + t, textcolor=col, color= color(na), style=label.style_label_down),
b4 = label.new(_5x, _5y, text= t + '(4)', textcolor=col, color= color(na), style=label.style_label_up ),
b5 = label.new(_6x, _6y, text= '(5)' + t, textcolor=col, color= color(na), style=label.style_label_down),
on = true ,
br = false ,
dir = 1
)
aEW.unshift(wave)
nFibL._break_ := false
alert('New EW Motive Bullish Pattern found' , alert.freq_once_per_bar_close)
//
if not isWave
if same and gEW.on == true
gEW.dot()
alert('Invalidated EW Motive Bullish Pattern', alert.freq_once_per_bar_close)
//
// –––––––––––––––––––––[ ABC ]–––––––––––––––––––––
getEW = aEW.get(0)
last_0x := getEW.l1.get_x1(), last_0y := getEW.l1.get_y1()
last_6x := getEW.l5.get_x2(), last_6y := getEW.l5.get_y2()
diff = math.abs(last_6y - last_0y)
//
if getEW.dir == -1
getX = getEW.l5.get_x2()
getY = getEW.l5.get_y2()
isSame2 = getEW.isSame2 (_1x, _2x, _3x)
isValid =
_3x == getX and
_6y < getY + (diff * i_854) and
_4y < getY + (diff * i_854) and
_5y > getY
//
if isValid
width = _6x - _2x // –––[ width (4) - (c) ]–––
if isSame2 and getEW.bA.get_x() > _3x
getEW.lC.set_xy1(_5x, _5y), getEW.lC.set_xy2(_6x, _6y), getEW.bC.set_xy(_6x, _6y), getEW.bx.set_lefttop(_6x, _6y), getEW.bx.set_right(_6x + width)
else
getEW.lA := line.new (_3x, _3y, _4x, _4y, color=col), getEW.bA := label.new(_4x, _4y, text= '(a)' + t, textcolor=col, color= color(na), style=label.style_label_down)
getEW.lB := line.new (_4x, _4y, _5x, _5y, color=col), getEW.bB := label.new(_5x, _5y, text= t + '(b)', textcolor=col, color= color(na), style=label.style_label_up )
getEW.lC := line.new (_5x, _5y, _6x, _6y, color=col), getEW.bC := label.new(_6x, _6y, text= '(c)' + t, textcolor=col, color= color(na), style=label.style_label_down)
getEW.bx := box.new (_6x, _6y, _6x + width, _4y, bgcolor=color.new(col, 93), border_color=color.new(col, 65))
alert('New EW Corrective Bullish Pattern found' , alert.freq_once_per_bar_close)
else
if isSame2 and getEW.bA.get_x() > _3x
getEW.dash()
alert('Invalidated EW Corrective Bullish Pattern', alert.freq_once_per_bar_close)
//
// –––––––––––––––––––––[ new (1) ? ]–––––––––––––––––––––
if getEW.dir == 1
if _5x == getEW.bC.get_x() and
_6y > getEW.b5.get_y() and
getEW.next == false
getEW.next := true
getEW.lb := label.new(_6x, _6y, style=label.style_circle, color=color.new(col, 65), yloc=yloc.abovebar, size=size.tiny)
alert('Possible new start of EW Motive Bullish Wave', alert.freq_once_per_bar_close)
//
// when a new Pivot Low is found
if not na(pl)
gEW := aEW.get (0)
dir := aZZ.d.get (0)
x1 := aZZ.x.get (0)
y1 := aZZ.y.get (0)
y2 := nz(lo[1])
//
if dir > -1 // if previous point was a ph, add, and change direction (-1)
in_out(aZZ, -1, x1, y1, x2, y2, col)
else
if dir == -1 and pl < y1
aZZ.x.set(0, x2), aZZ.y.set(0, y2)
if shZZ
aZZ.l.get(0).set_xy2(x2, y2)
//
_6x = x2, _6y = y2
_5x = aZZ.x.get(1), _5y = aZZ.y.get(1)
_4x = aZZ.x.get(2), _4y = aZZ.y.get(2)
_3x = aZZ.x.get(3), _3y = aZZ.y.get(3)
_2x = aZZ.x.get(4), _2y = aZZ.y.get(4)
_1x = aZZ.x.get(5), _1y = aZZ.y.get(5)
//
// –––––––––––––––––––––[ 12345 ]–––––––––––––––––––––
_W5 = _5y - _6y
_W3 = _3y - _4y
_W1 = _1y - _2y
min = math.min(_W1, _W3, _W5)
isWave =
_W3 != min and
_4y > _6y and
_1y > _3y and
_2y > _5y
//
same = isSame(gEW, _1x, _2x, _3x, _4x)
if isWave
if same
gEW.l5.set_xy2(_6x, _6y)
gEW.b5.set_xy (_6x, _6y)
else
tx = ''
if _2x == aEW.get(0).b5.get_x()
tx := '(5) (1)'
aEW.get(0).b5.set_text('')
else
tx := '(1)'
//
wave = Ewave.new(
l1 = line.new (_1x, _1y, _2x, _2y , color=col , style= line.style_solid ),
l2 = line.new (_2x, _2y, _3x, _3y , color=col , style= line.style_solid ),
l3 = line.new (_3x, _3y, _4x, _4y , color=col , style= line.style_solid ),
l4 = line.new (_4x, _4y, _5x, _5y , color=col , style= line.style_solid ),
l5 = line.new (_5x, _5y, _6x, _6y , color=col , style= line.style_solid ),
b1 = label.new(_2x, _2y, text= t + tx, textcolor=col, color= color(na), style=label.style_label_up ),
b2 = label.new(_3x, _3y, text= '(2)' + t, textcolor=col, color= color(na), style=label.style_label_down),
b3 = label.new(_4x, _4y, text= t + '(3)', textcolor=col, color= color(na), style=label.style_label_up ),
b4 = label.new(_5x, _5y, text= '(4)' + t, textcolor=col, color= color(na), style=label.style_label_down),
b5 = label.new(_6x, _6y, text= t + '(5)', textcolor=col, color= color(na), style=label.style_label_up ),
on = true ,
br = false ,
dir =-1
)
aEW.unshift(wave)
nFibL._break_ := false
alert('New EW Motive Bearish Pattern found' , alert.freq_once_per_bar_close)
//
if not isWave
if same and gEW.on == true
gEW.dot()
alert('Invalidated EW Motive Bearish Pattern', alert.freq_once_per_bar_close)
//
// –––––––––––––––––––––[ ABC ]–––––––––––––––––––––
getEW = aEW.get(0)
last_0x := getEW.l1.get_x1(), last_0y := getEW.l1.get_y1()
last_6x := getEW.l5.get_x2(), last_6y := getEW.l5.get_y2()
diff = math.abs(last_6y - last_0y)
//
if getEW.dir == 1
getX = getEW.l5.get_x2()
getY = getEW.l5.get_y2()
isSame2 = getEW.isSame2 (_1x, _2x, _3x)
isValid =
_3x == getX and
_6y > getY - (diff * i_854) and
_4y > getY - (diff * i_854) and
_5y < getY
//
if isValid
width = _6x - _2x // –––[ width (4) - (c) ]–––
if isSame2 and getEW.bA.get_x() > _3x
getEW.lC.set_xy1(_5x, _5y), getEW.lC.set_xy2(_6x, _6y), getEW.bC.set_xy(_6x, _6y), getEW.bx.set_lefttop(_6x, _6y), getEW.bx.set_right(_6x + width)
else
getEW.lA := line.new (_3x, _3y, _4x, _4y, color=col), getEW.bA := label.new(_4x, _4y, text= t + '(a)', textcolor=col, color= color(na), style=label.style_label_up )
getEW.lB := line.new (_4x, _4y, _5x, _5y, color=col), getEW.bB := label.new(_5x, _5y, text= '(b)' + t, textcolor=col, color= color(na), style=label.style_label_down)
getEW.lC := line.new (_5x, _5y, _6x, _6y, color=col), getEW.bC := label.new(_6x, _6y, text= t + '(c)', textcolor=col, color= color(na), style=label.style_label_up )
getEW.bx := box.new (_6x, _6y, _6x + width, _4y, bgcolor=color.new(col, 93), border_color=color.new(col, 65))
alert('New EW Corrective Bearish Pattern found' , alert.freq_once_per_bar_close)
else
if isSame2 and getEW.bA.get_x() > _3x
getEW.dash()
alert('Invalidated EW Corrective Bullish Pattern', alert.freq_once_per_bar_close)
//
// –––[ check (only once) for a possible new (1) after an impulsive AND corrective wave ]–––
if getEW.dir == -1
if _5x == getEW.bC.get_x() and
_6y < getEW.b5.get_y() and
getEW.next == false
getEW.next := true
getEW.lb := label.new(_6x, _6y, style=label.style_circle, color=color.new(col, 65), yloc=yloc.belowbar, size=size.tiny)
alert('Possible new start of EW Motive Bearish Wave', alert.freq_once_per_bar_close)
//
// –––[ check for break box ]–––
if aEW.size() > 0
gEW := aEW.get(0)
if gEW.dir == 1
if ta.crossunder(low , gEW.bx.get_bottom()) and bar_index <= gEW.bx.get_right()
label.new(bar_index, low , yloc= yloc.belowbar, style= label.style_xcross, color=color.red, size=size.tiny)
else
if ta.crossover (high, gEW.bx.get_top ()) and bar_index <= gEW.bx.get_right()
label.new(bar_index, high, yloc= yloc.abovebar, style= label.style_xcross, color=color.red, size=size.tiny)
//
if barstate.islast
// –––[ get last 2 EW's ]–––
getEW = aEW.get(0)
if aEW.size() > 1
getEW1 = aEW.get(1)
last_0x := getEW.l1.get_x1(), last_0y := getEW.l1.get_y1()
last_6x := getEW.l5.get_x2(), last_6y := getEW.l5.get_y2()
//
diff = math.abs(last_6y - last_0y) // –––[ max/min difference ]–––
_500 = diff * i_500
_618 = diff * i_618
_764 = diff * i_764
_854 = diff * i_854
bull = getEW.dir == 1
// –––[ if EW is not valid or an ABC has developed -> remove fibonacci lines ]–––
if getEW.on == false or getEW.bC.get_x() > getEW.b5.get_x()
nFibL.setNa()
else
// –––[ get.on == true ~ valid EW ]–––
max_500 = last_6y + ((bull ? -1 : 1) * _500)
max_618 = last_6y + ((bull ? -1 : 1) * _618)
max_764 = last_6y + ((bull ? -1 : 1) * _764)
max_854 = last_6y + ((bull ? -1 : 1) * _854)
//
nFibL.set(last_6x, bar_index + 10, max_500, max_618, max_764, max_854, last_6y)
// –––[ if (2) label overlap with (C) label ]–––
if getEW.b2.get_x() == getEW1.bC.get_x()
getEW.b1.set_textcolor(color(na))
getEW.b2.set_textcolor(color(na))
strB = getEW1.bB.get_text()
strC = getEW1.bC.get_text()
strB_ = str.replace(strB, "(b)", "(b) (1)", 0)
strC_ = str.replace(strC, "(c)", "(c) (2)", 0)
getEW1.bB.set_text(strB_)
getEW1.bC.set_text(strC_)
//
// –––[ check if fib limits are broken ]–––
getP_854 = nFibL.wave1_0_854.get_y1()
for i = 0 to bar_index - nFibL.wave1_0_854.get_x1()
if getEW.dir == -1
if high[i] > getP_854
nFibL._break_ := true
break
else
if low [i] < getP_854
nFibL._break_ := true
break
//––––––––––––––––––––––––––––––––––––––––––––––––––––––––––––––––––––––––––––––––
switch nFibL._break_
true => nFibL.sol_dot('dot', color.new(color.red , 95))
false => nFibL.sol_dot('sol', color.new(color.lime, 95))
=>
nFibL.wave1_0_500.set_xy1(na, na)
nFibL.wave1_0_500.set_xy2(na, na)
nFibL.wave1_0_618.set_xy1(na, na)
nFibL.wave1_0_618.set_xy2(na, na)
nFibL.wave1_0_764.set_xy1(na, na)
nFibL.wave1_0_764.set_xy2(na, na)
nFibL.wave1_0_854.set_xy1(na, na)
nFibL.wave1_0_854.set_xy2(na, na)
nFibL.wave1_pole_.set_xy1(na, na)
nFibL.wave1_pole_.set_xy2(na, na)
nFibL.l_fill_.set_color(color(na))
if aEW.size() > 15
pop = aEW.pop()
pop.l1.delete(), pop.b1.delete()
pop.l2.delete(), pop.b2.delete()
pop.l3.delete(), pop.b3.delete()
pop.l4.delete(), pop.b4.delete()
pop.l5.delete(), pop.b5.delete()
pop.lA.delete(), pop.bA.delete()
pop.lB.delete(), pop.bB.delete()
pop.lC.delete(), pop.bC.delete()
pop.lb.delete(), pop.bx.delete()
//----------------------------------
//-----------------------------------------------------------------------------}
//Plots
//-----------------------------------------------------------------------------{
draw(s1, len1, col1, 0)
draw(s2, len2, col2, 1)
draw(s3, len3, col3, 2)
//-----------------------------------------------------------------------------}